Media Images, videos, and other data visualizations.
Note: that everything on this page is intended for public distribution. Anyone is welcome to download, distribute, and share images/videos presented here. For presentation in talks, posters, etc we would anticipate a text credit to "Illustris Collaboration" / "Illustris Simulation". Each image links to a larger version. Some images have additional, particularly large versions available (e.g. for printing).
For any commercial (non-academic) uses please contact us first.
Images:
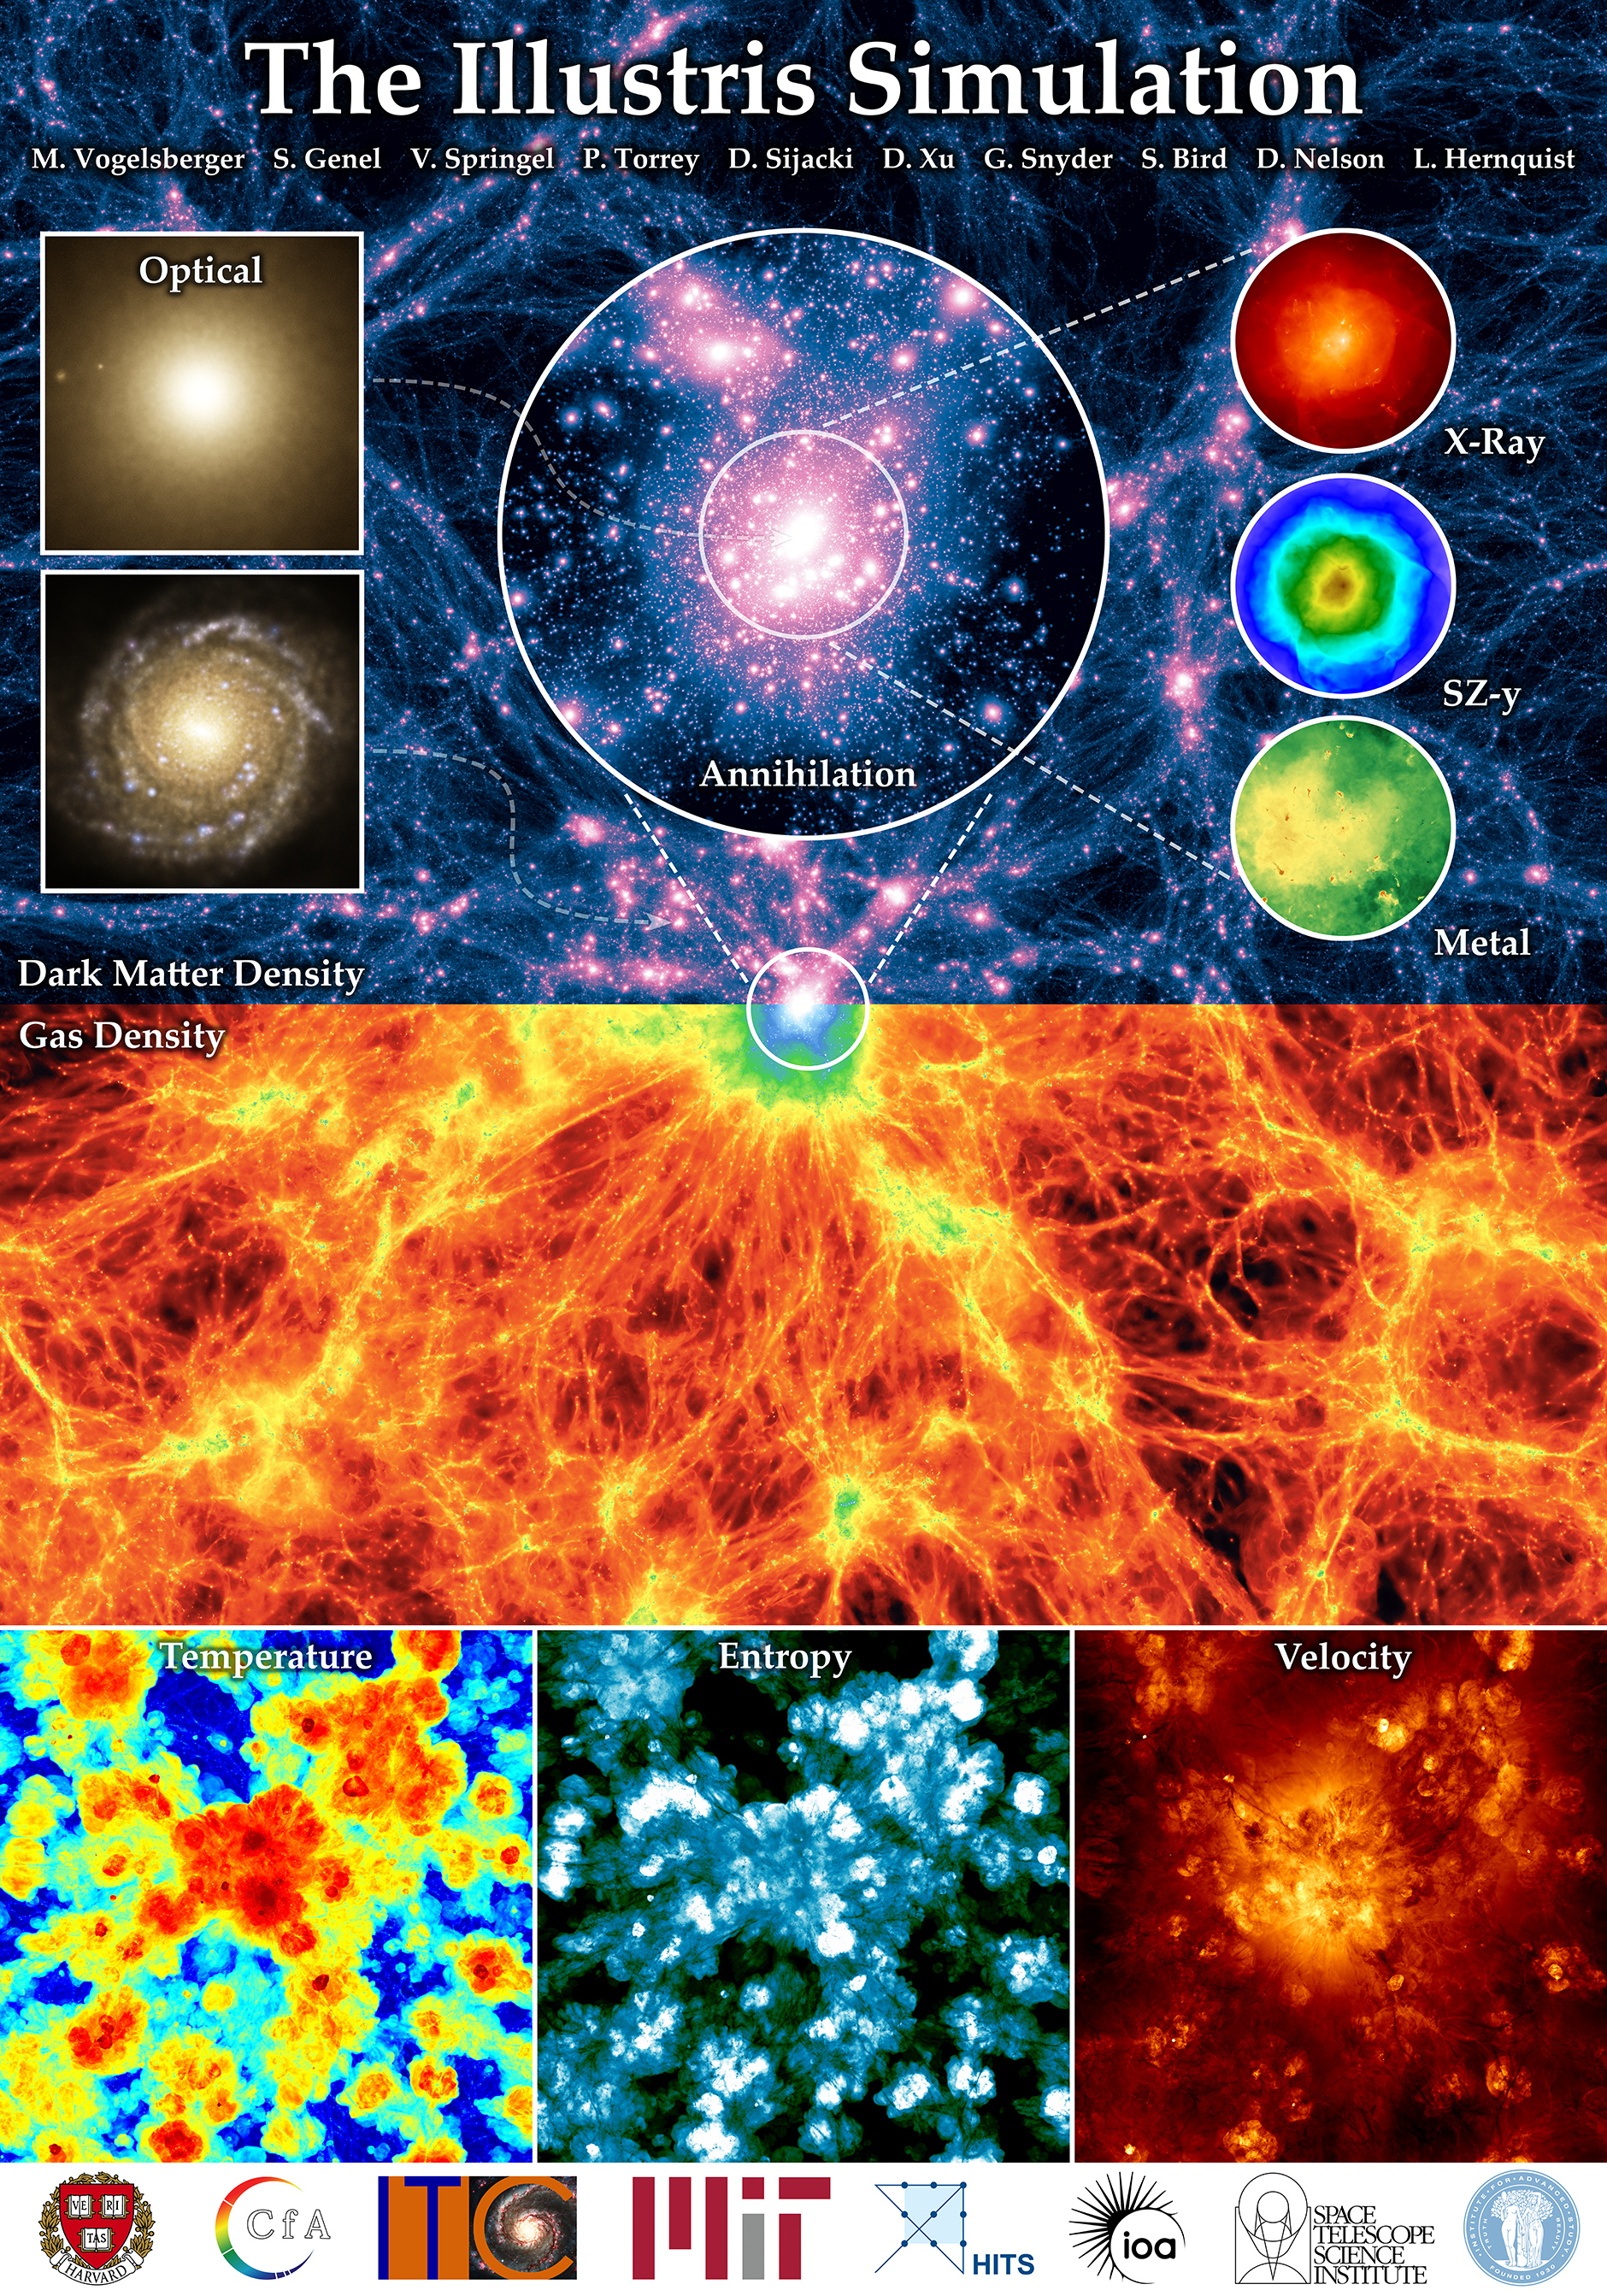
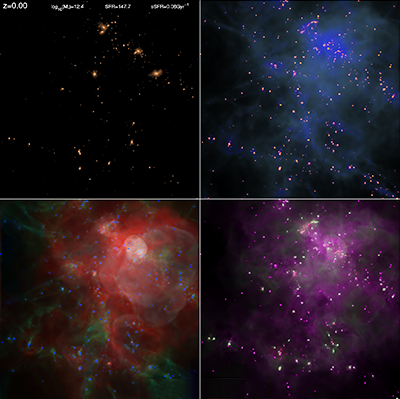
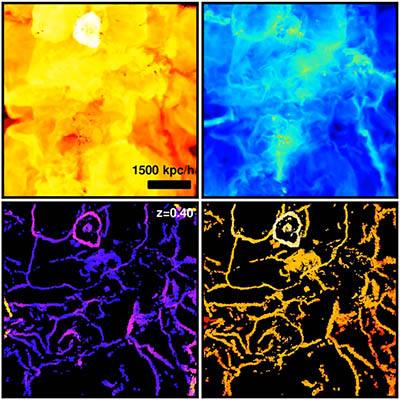
Illustris simulation overview poster. Shows the large scale dark matter and gas density fields in projection (top/bottom). The lower three panels show gas temperature, entropy, and velocity at the same scale. Centered on the most massive cluster, for which the circular insets show four predicted observables. The two galaxy insets highlight a central elliptical and a spiral disk satellite (top/bottom).
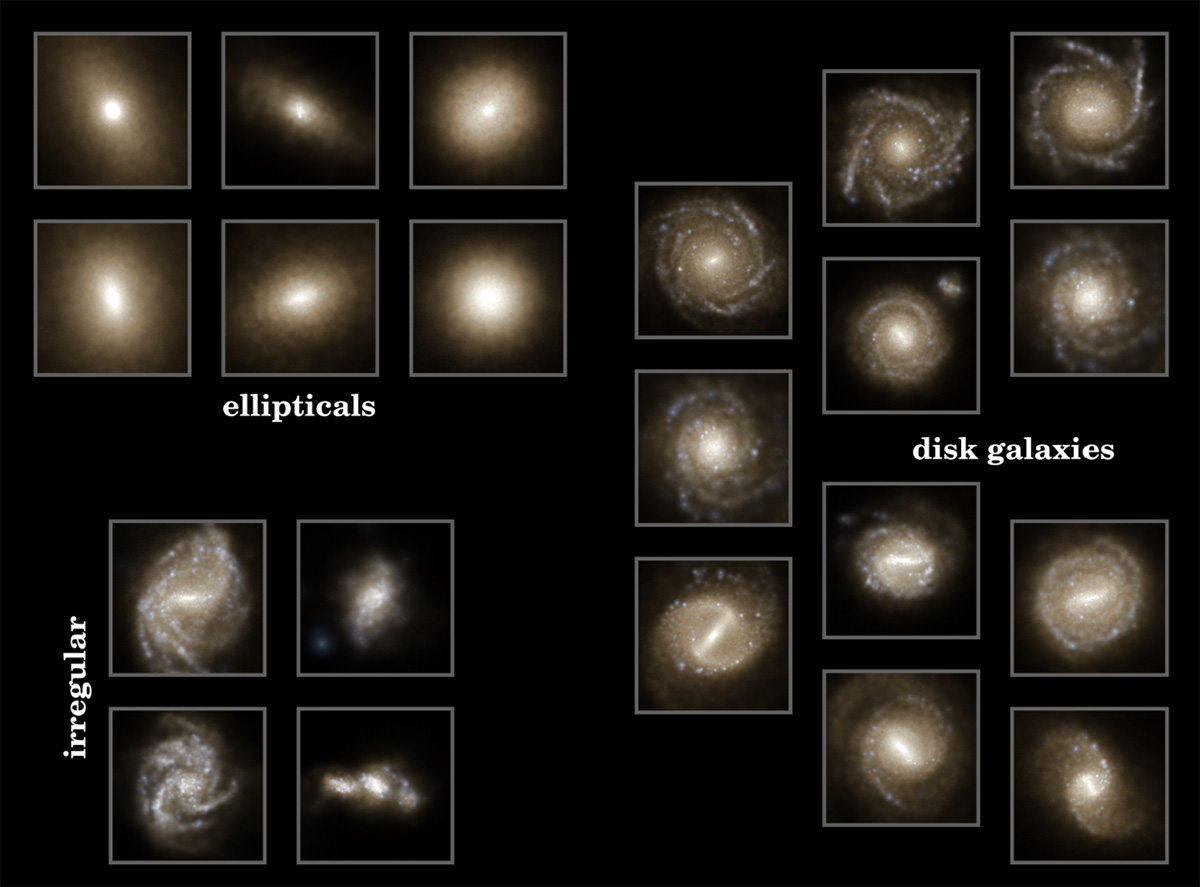
Stellar light distributions (g,r,i bands) for a sample of galaxies at z = 0 arranged along the classical Hubble sequence for morphological classification. Our simulation produces a variety of galaxy types ranging from ellipticals to disk galaxies to irregular systems, the latter mostly resulting from interactions and mergers.
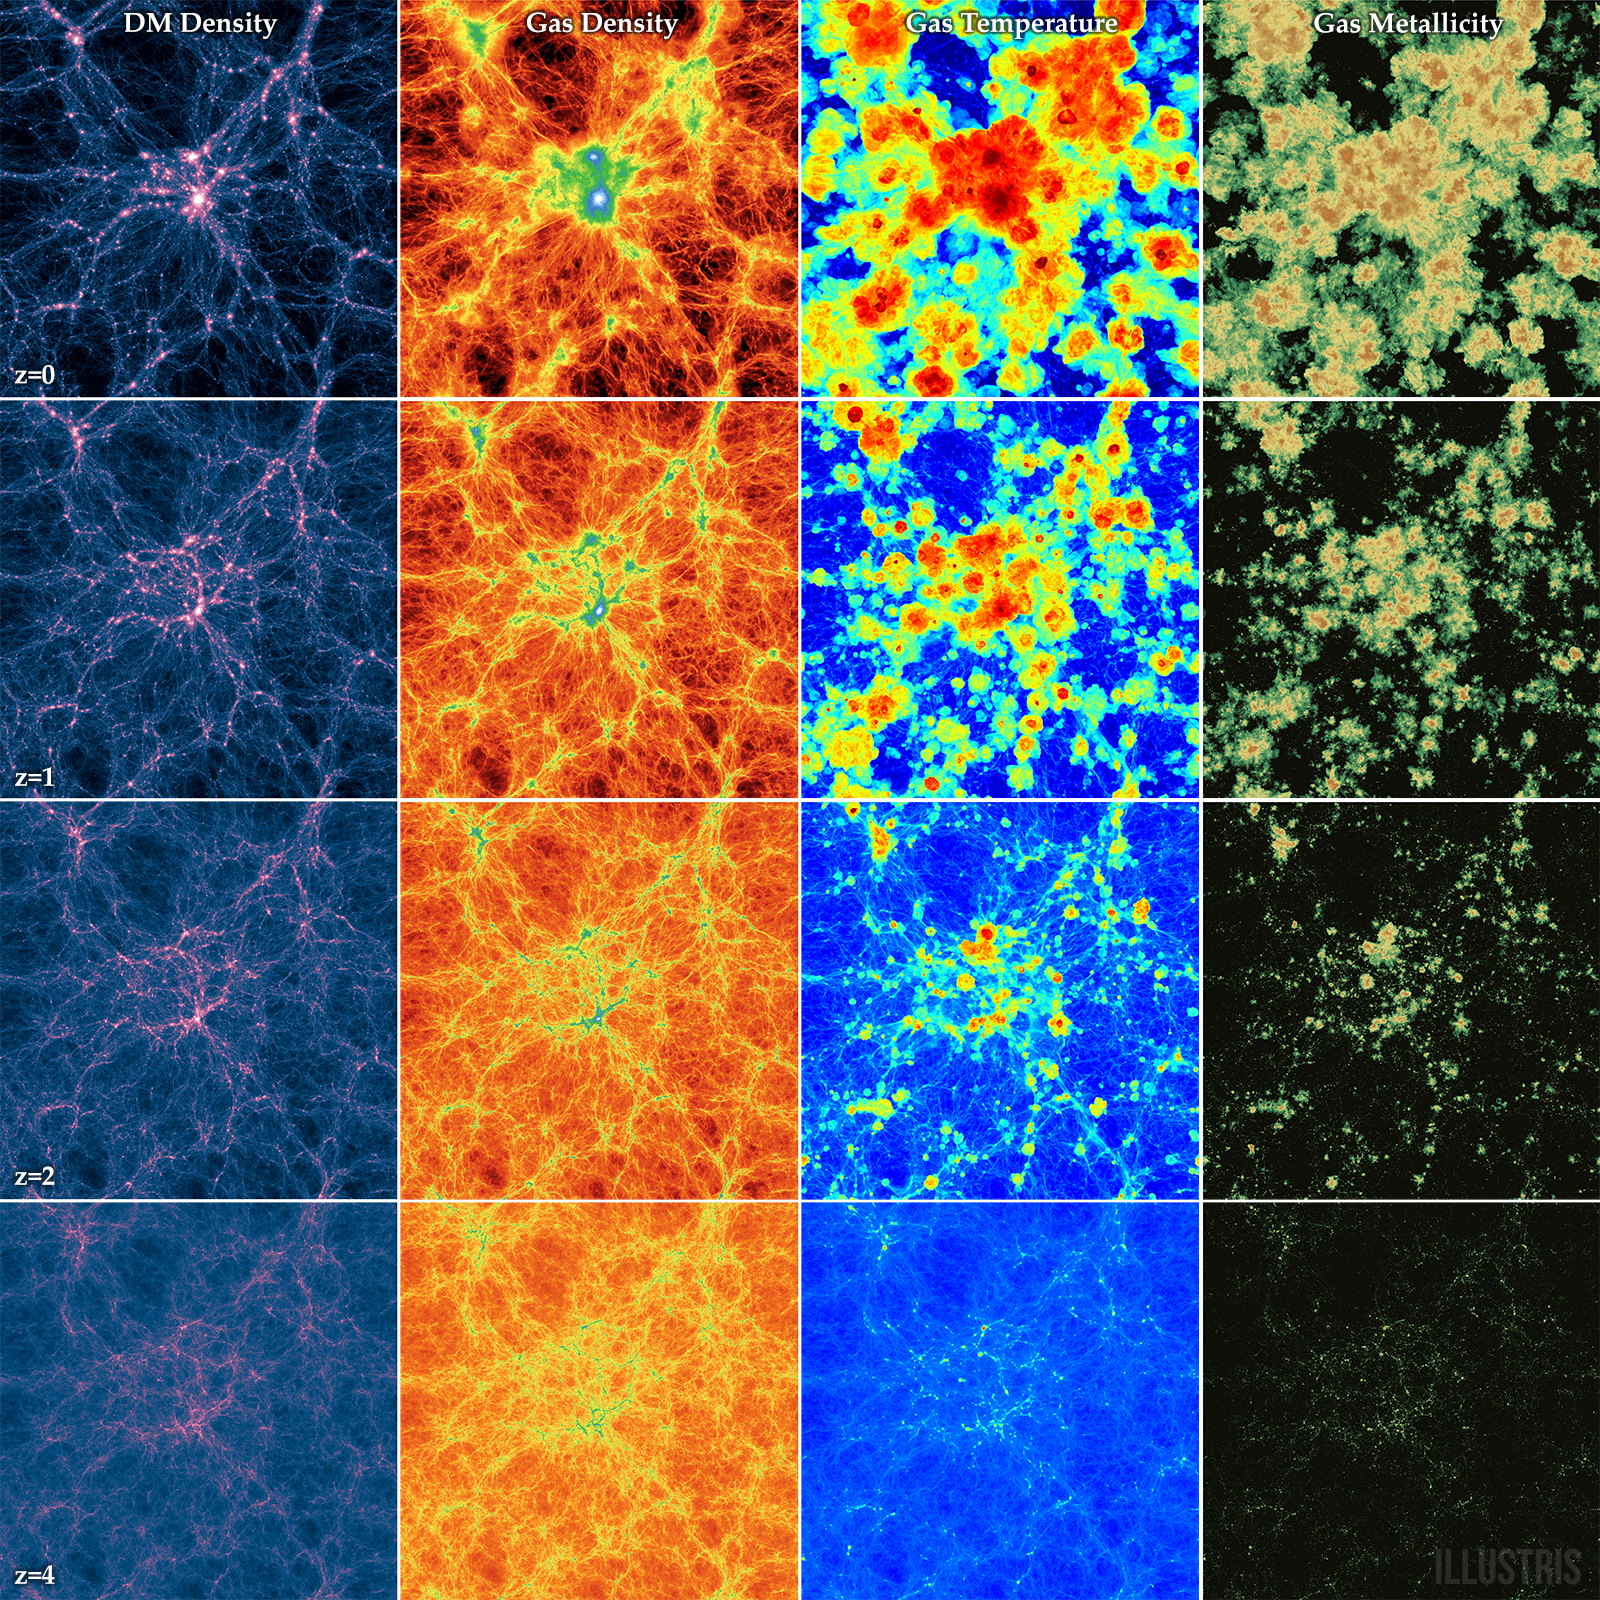
Redshift evolution of a whole box slice from z=4 to z=0, showing four projections: dark matter density, gas density, gas temperature, and gas metallicity.
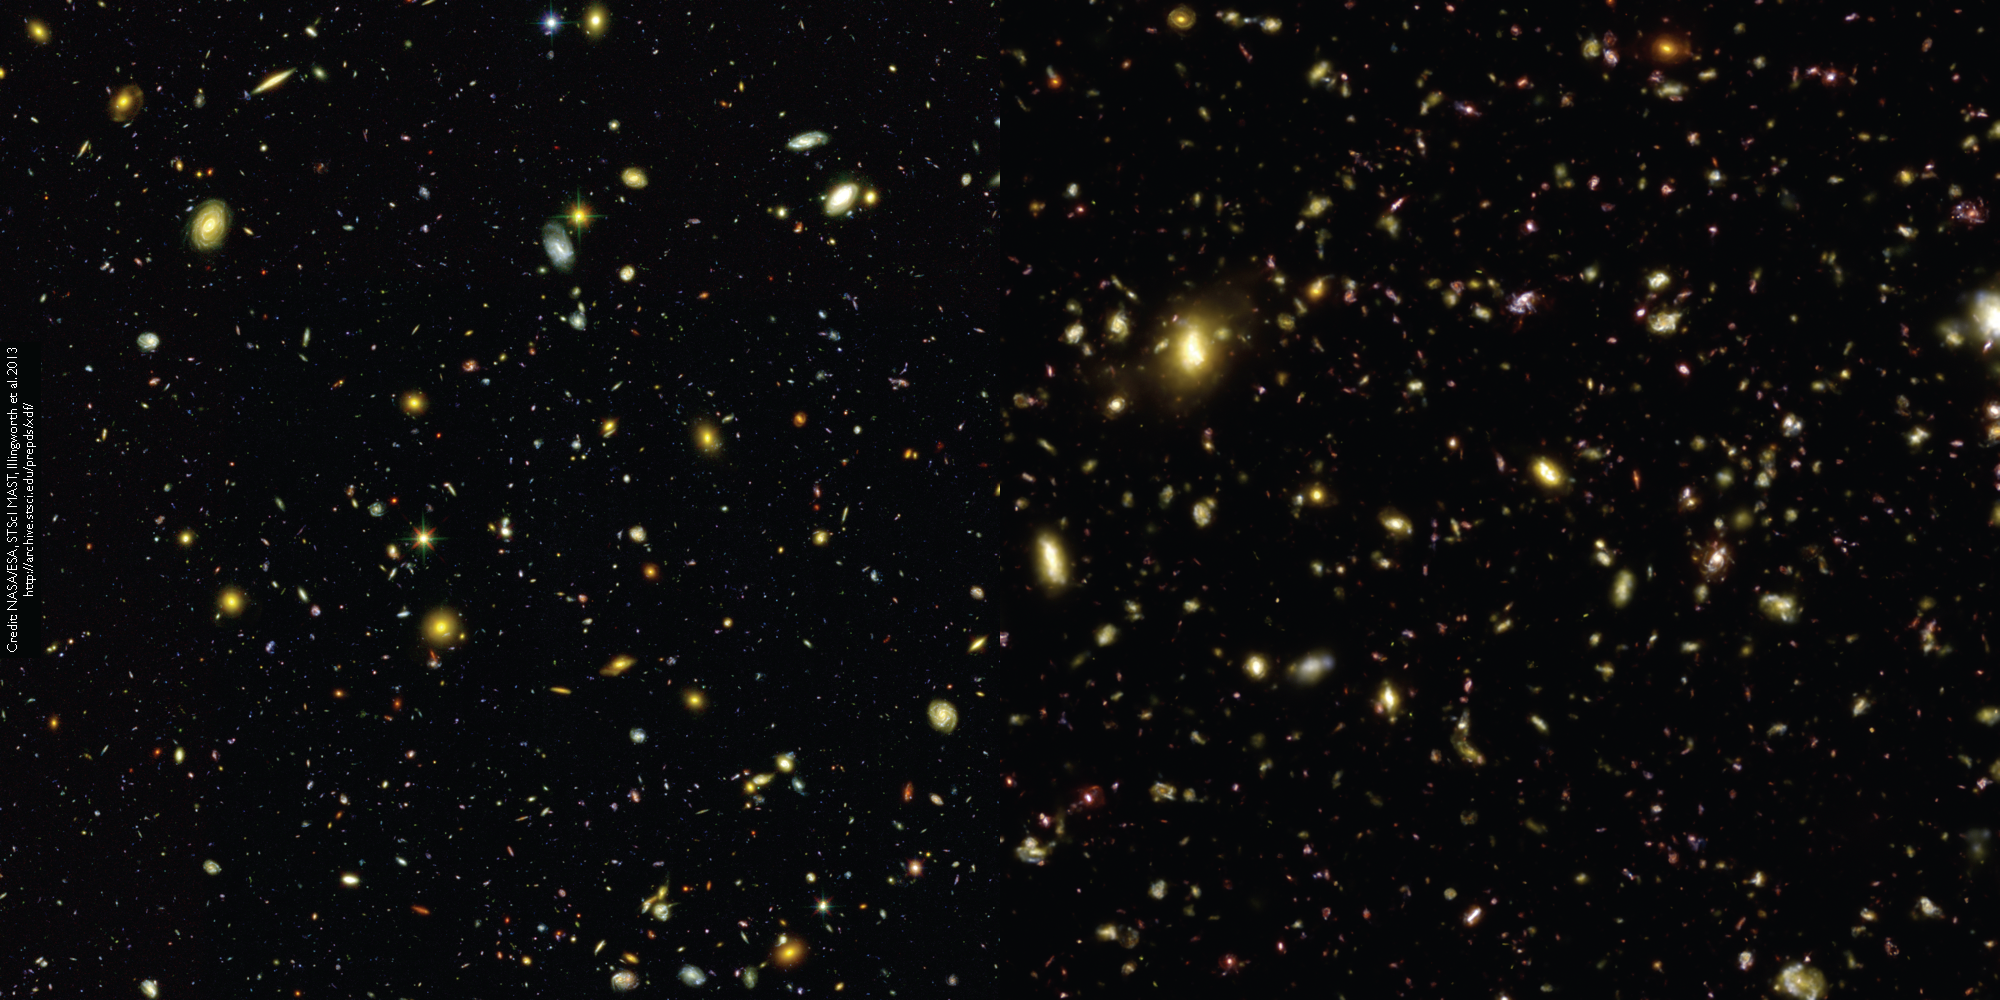
Hubble eXtreme Deep Field observations (2.8 arcmin on a side) in B, Z, H bands convolved with Gaussian point-spread functions of sigma = 0.04, 0.08, and 0.16 arcsec, respectively. Divided down the middle: real observation (left side) and mock observation from Illustris (right side).
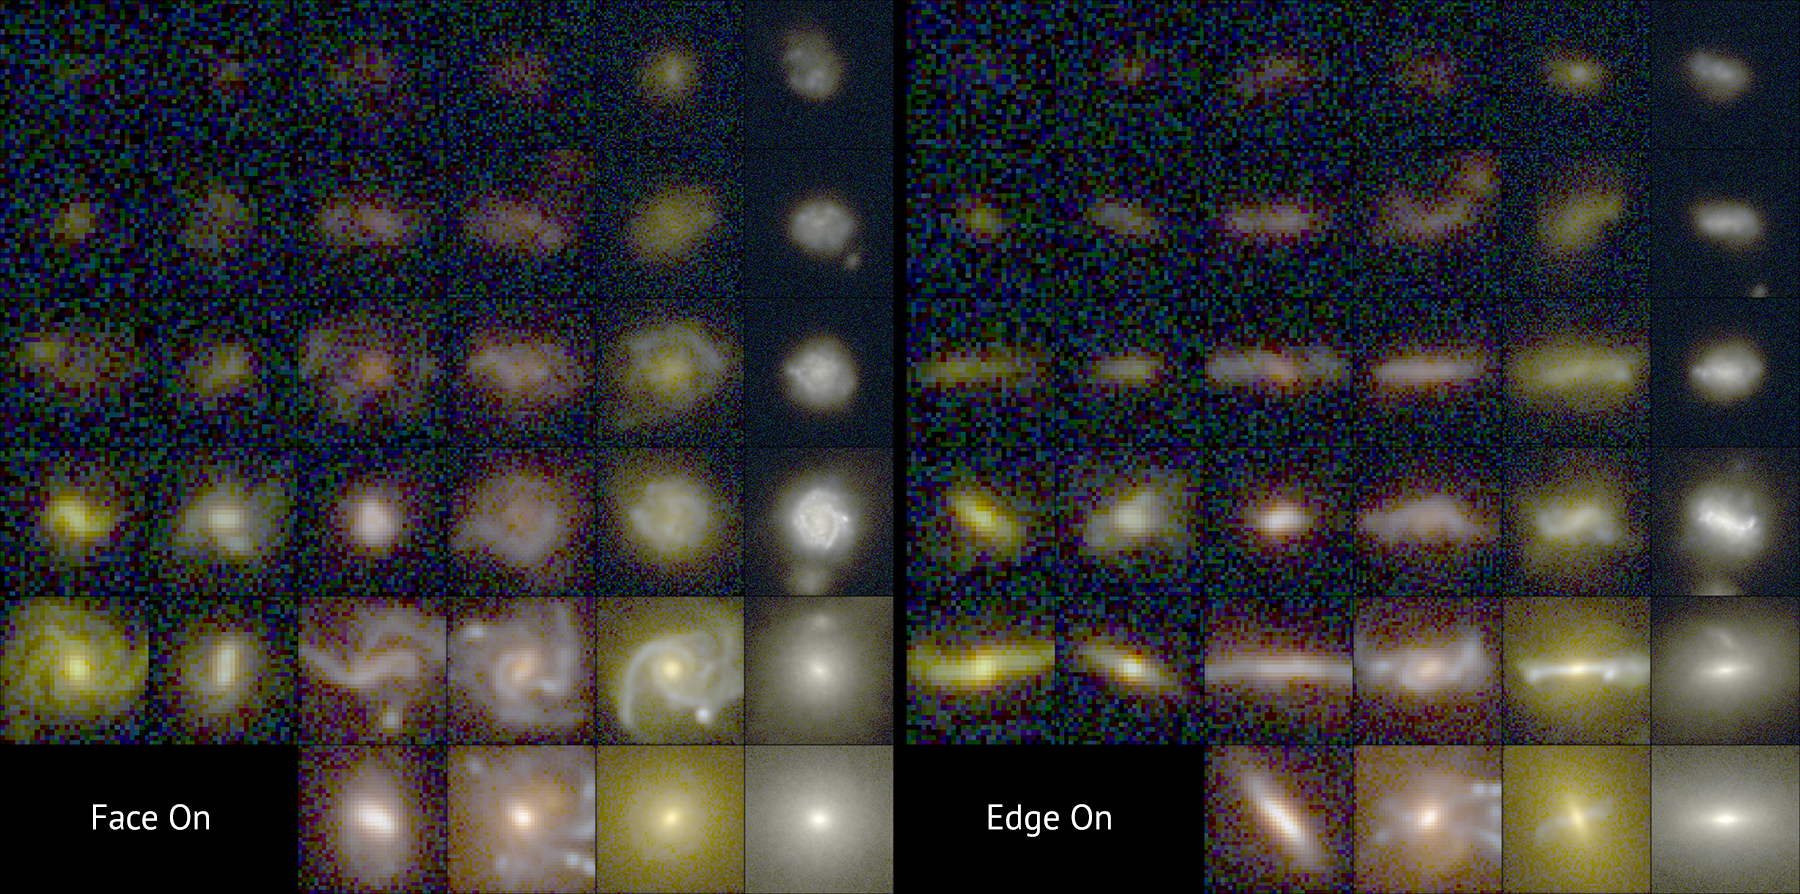
Mock HST eXtreme Deep Field observations of a selection of galaxies in the observed-frame V, Y, H bands, taking into account dust attenuation. The rows show increasing stellar masses from 109 (top) to 1011.5 solar masses (bottom), and the columns show redshifts from z=5 (left) to z=0 (right).
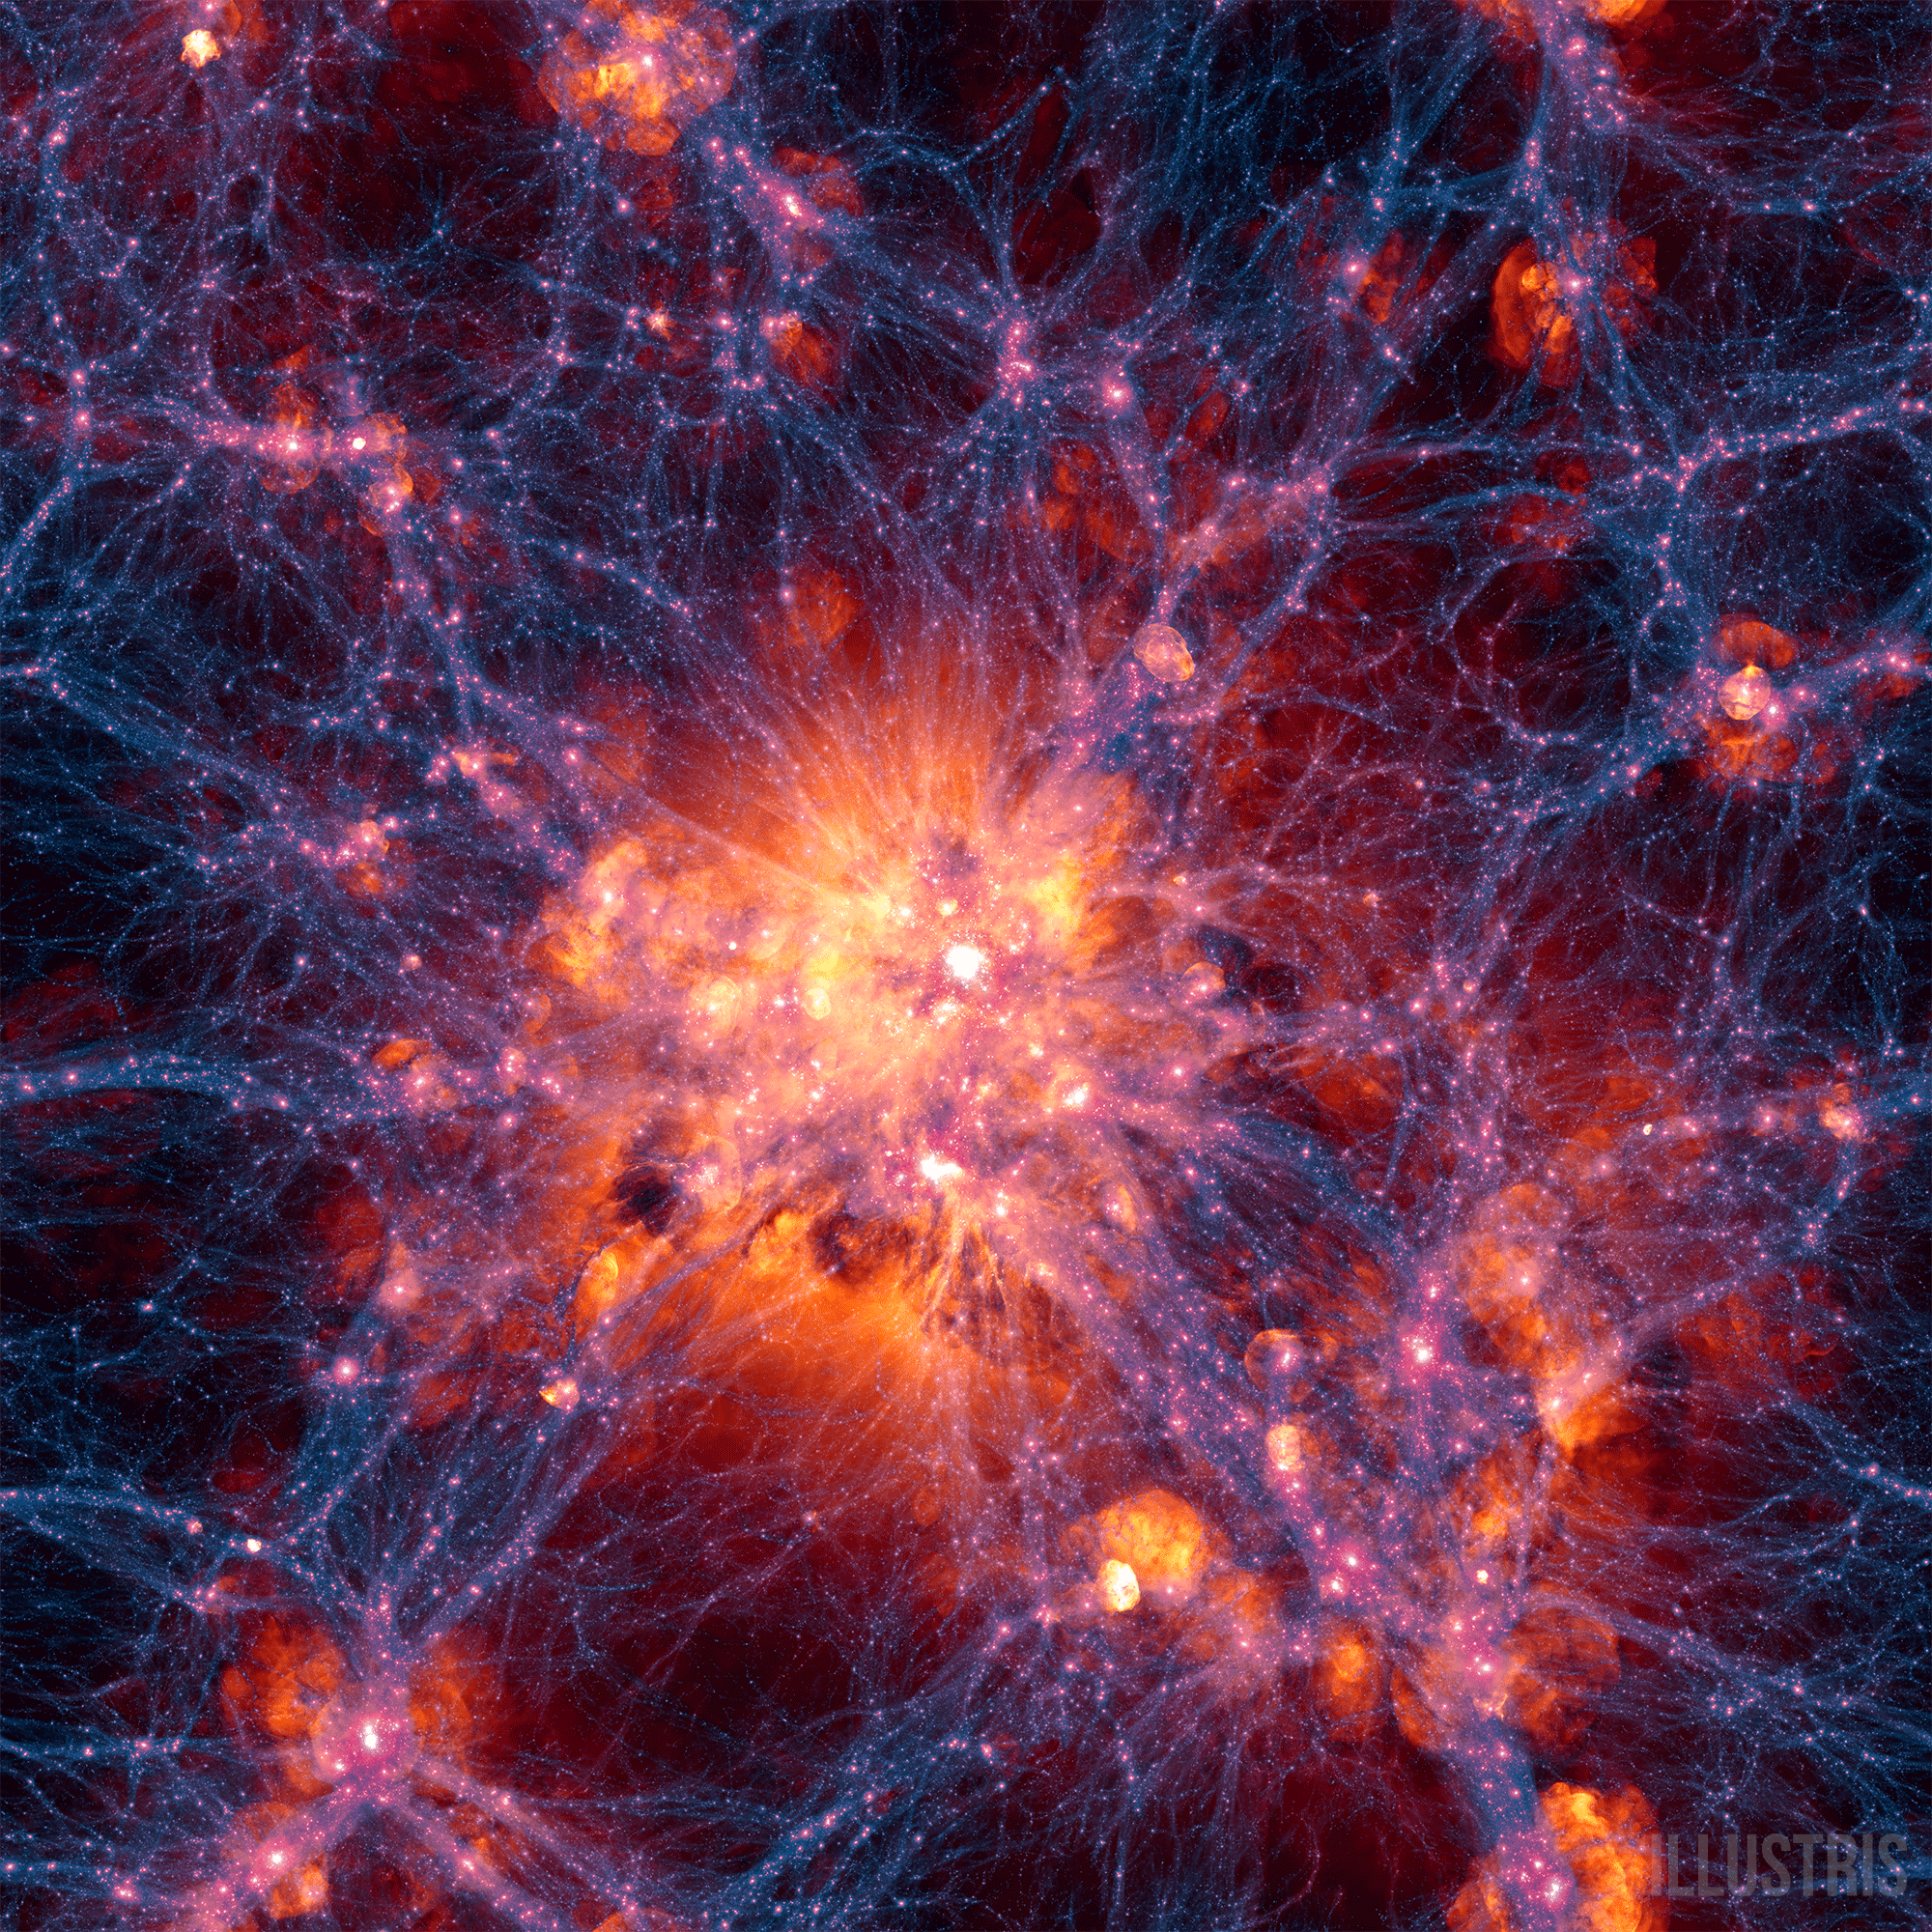
Large scale projection through the Illustris volume at z=0, centered on the most massive cluster, 15 Mpc/h deep. Shows dark matter density overlaid with the gas velocity field.
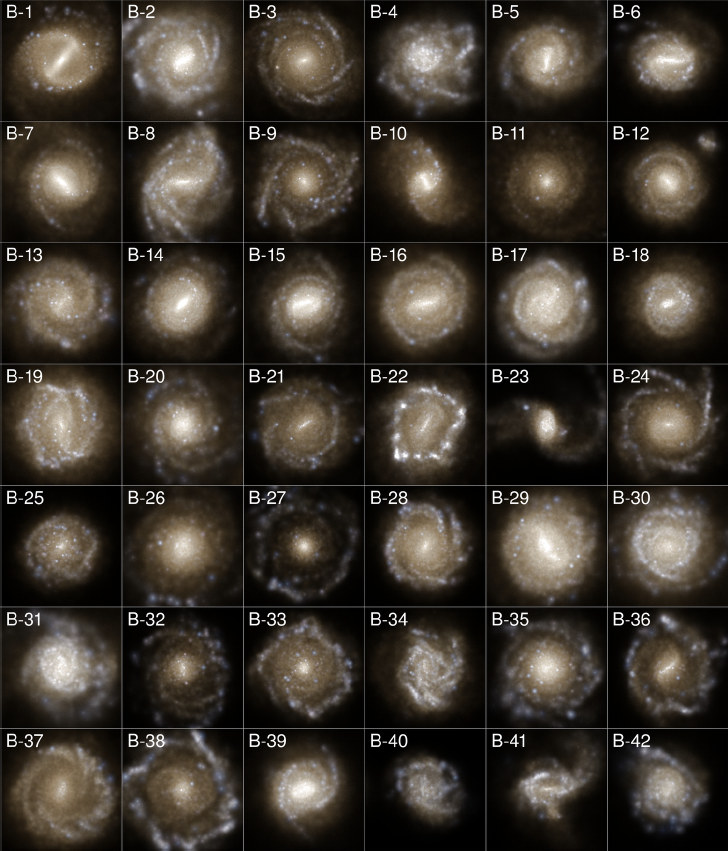
Sample of 42 blue, disk galaxies, showing the stellar light distribution (SDSS g,r,i band composites).
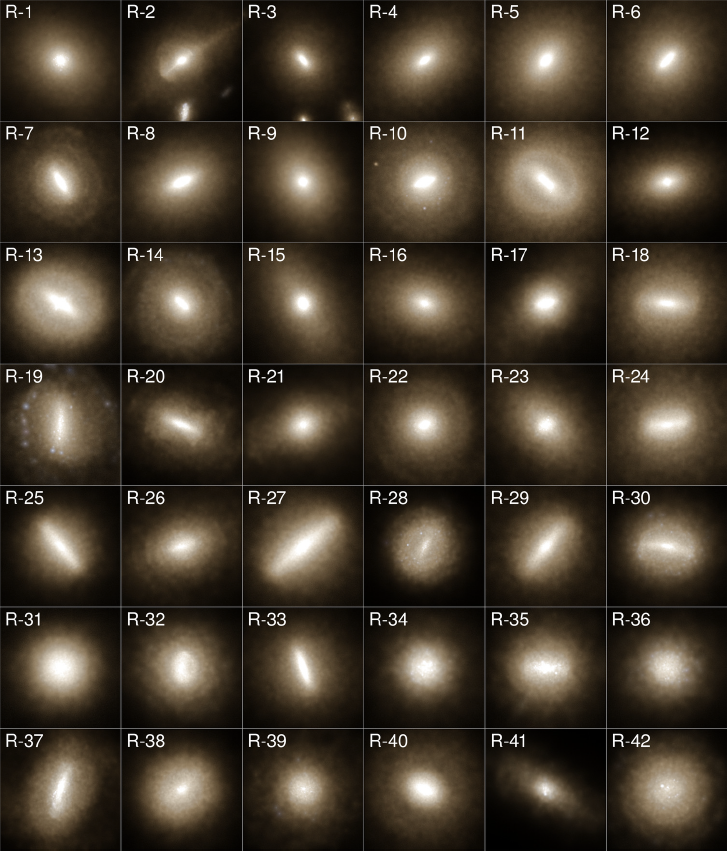
Sample of 42 red, elliptical galaxies, showing the stellar light distribution (SDSS g,r,i band composites).
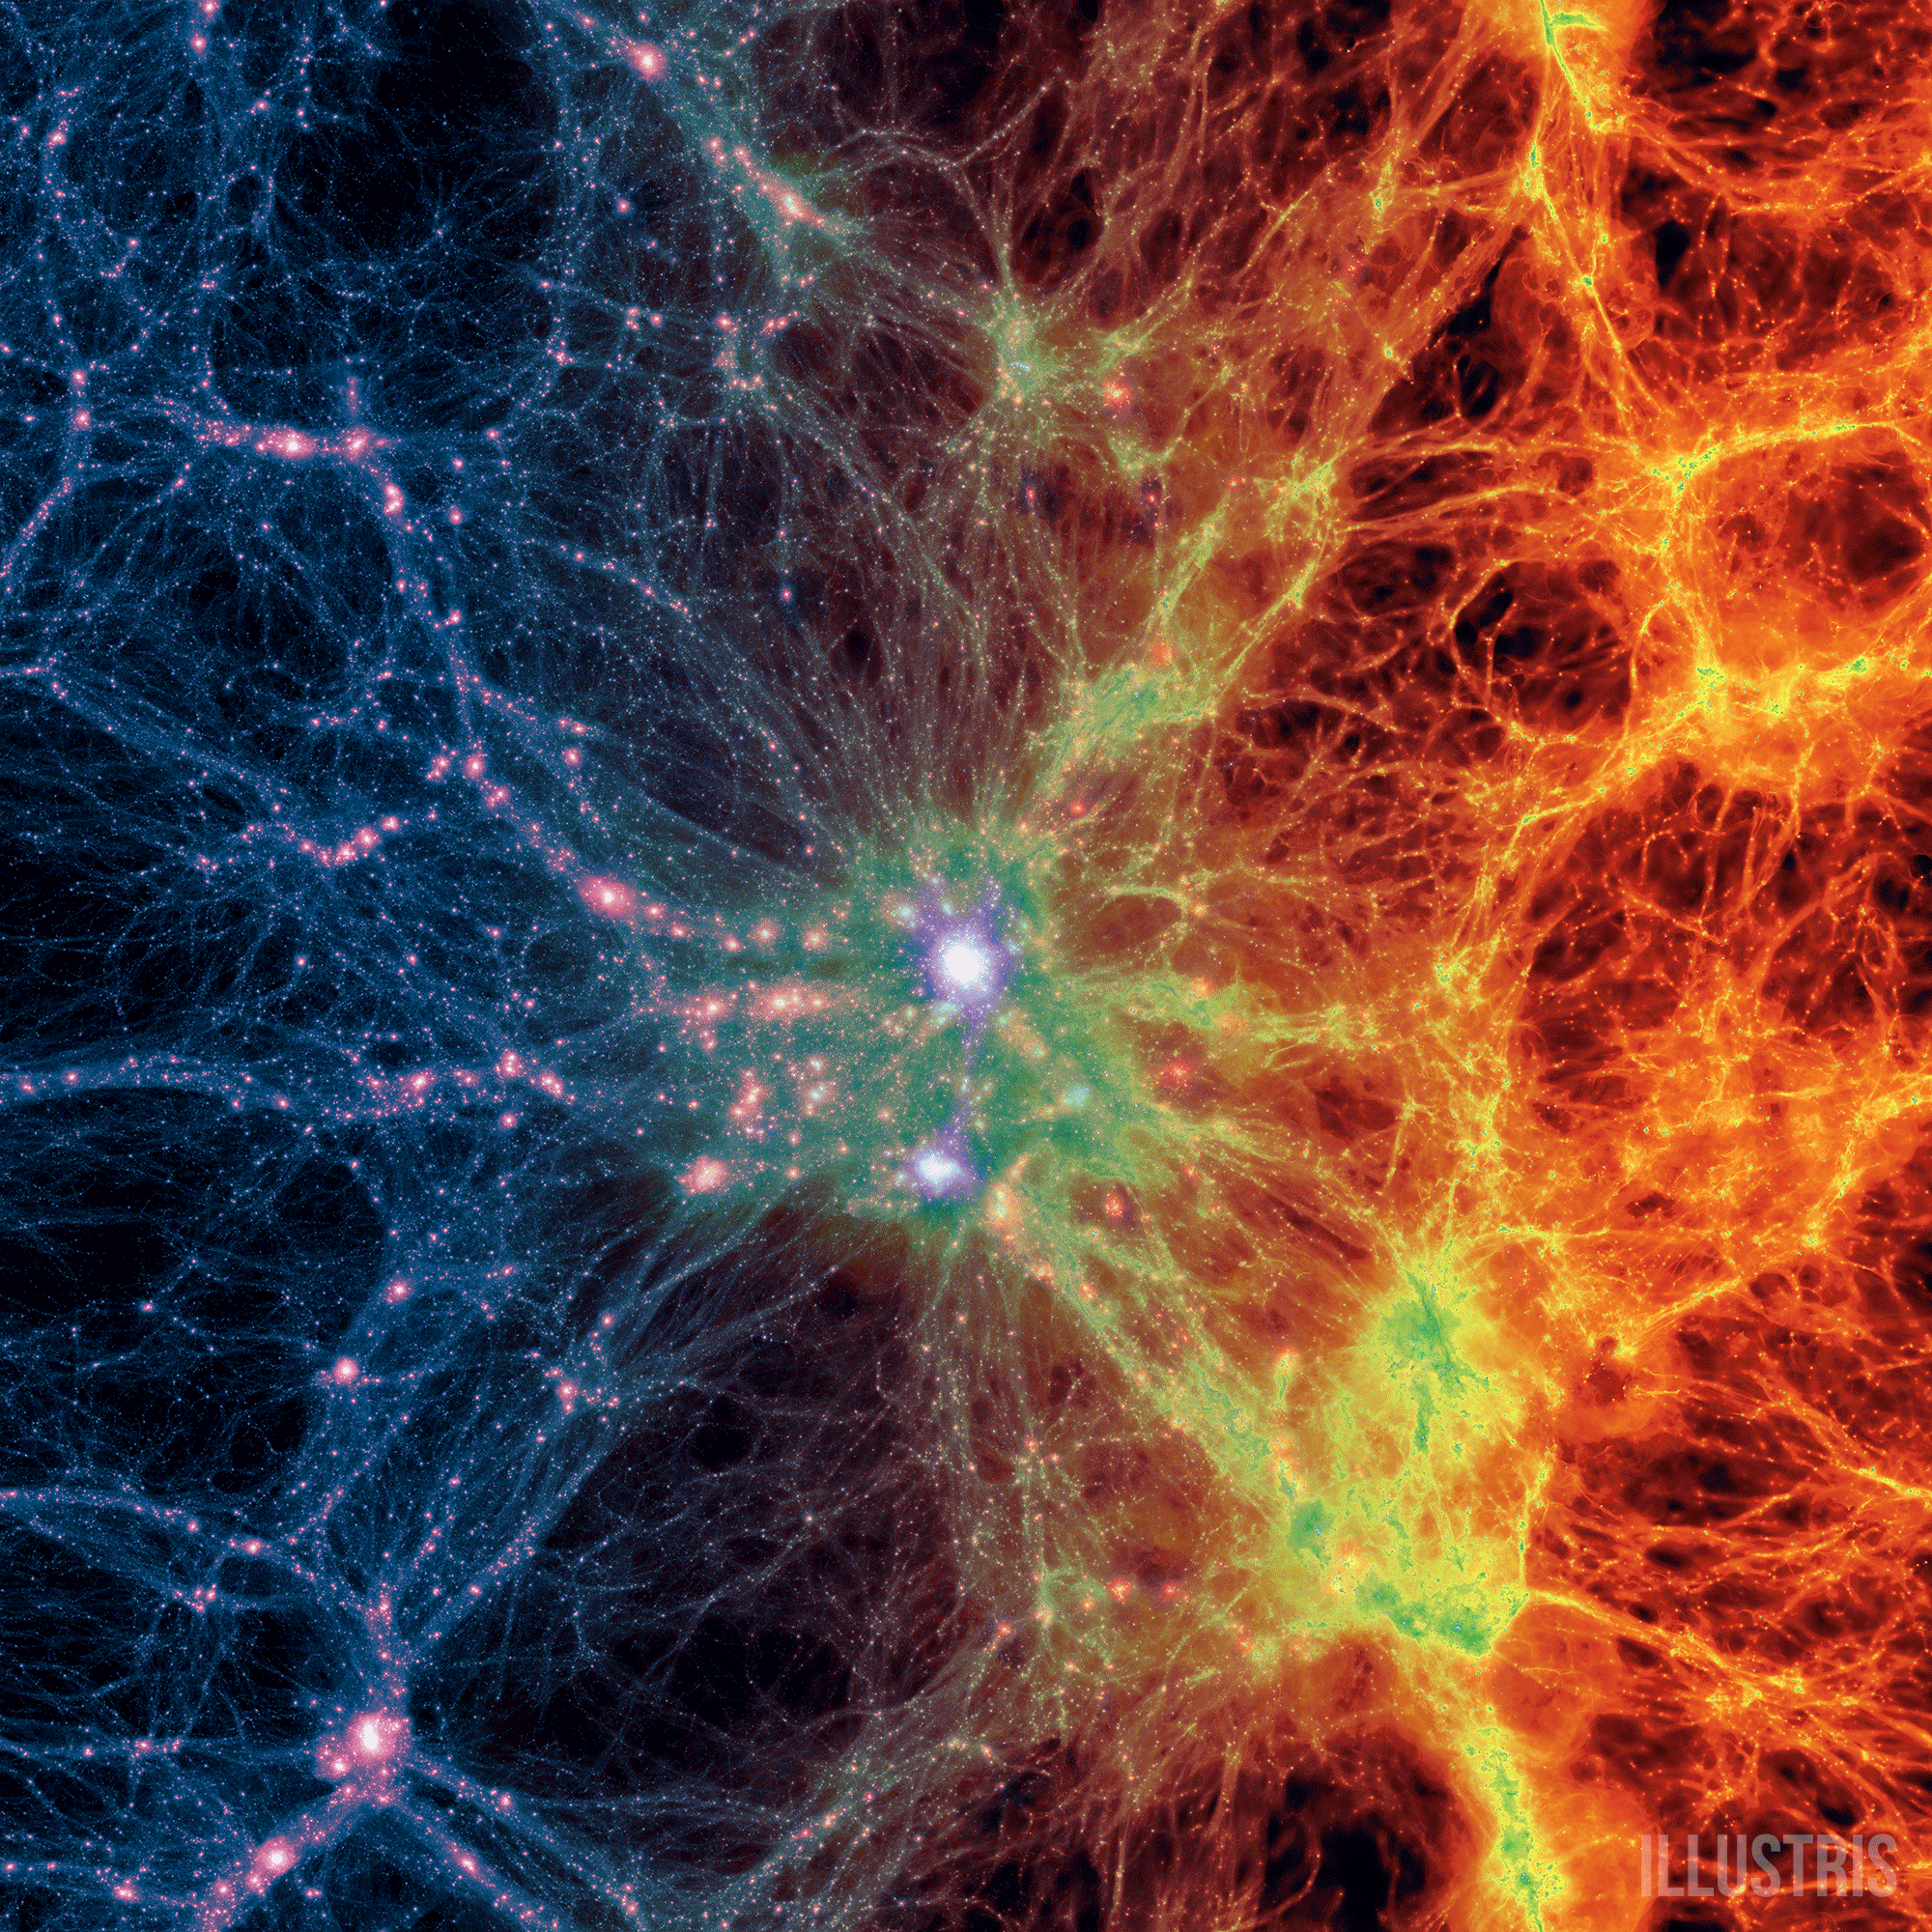
Large scale projection through the Illustris volume at z=0, centered on the most massive cluster, 15 Mpc/h deep. Shows dark matter density (left) transitioning to gas density (right).
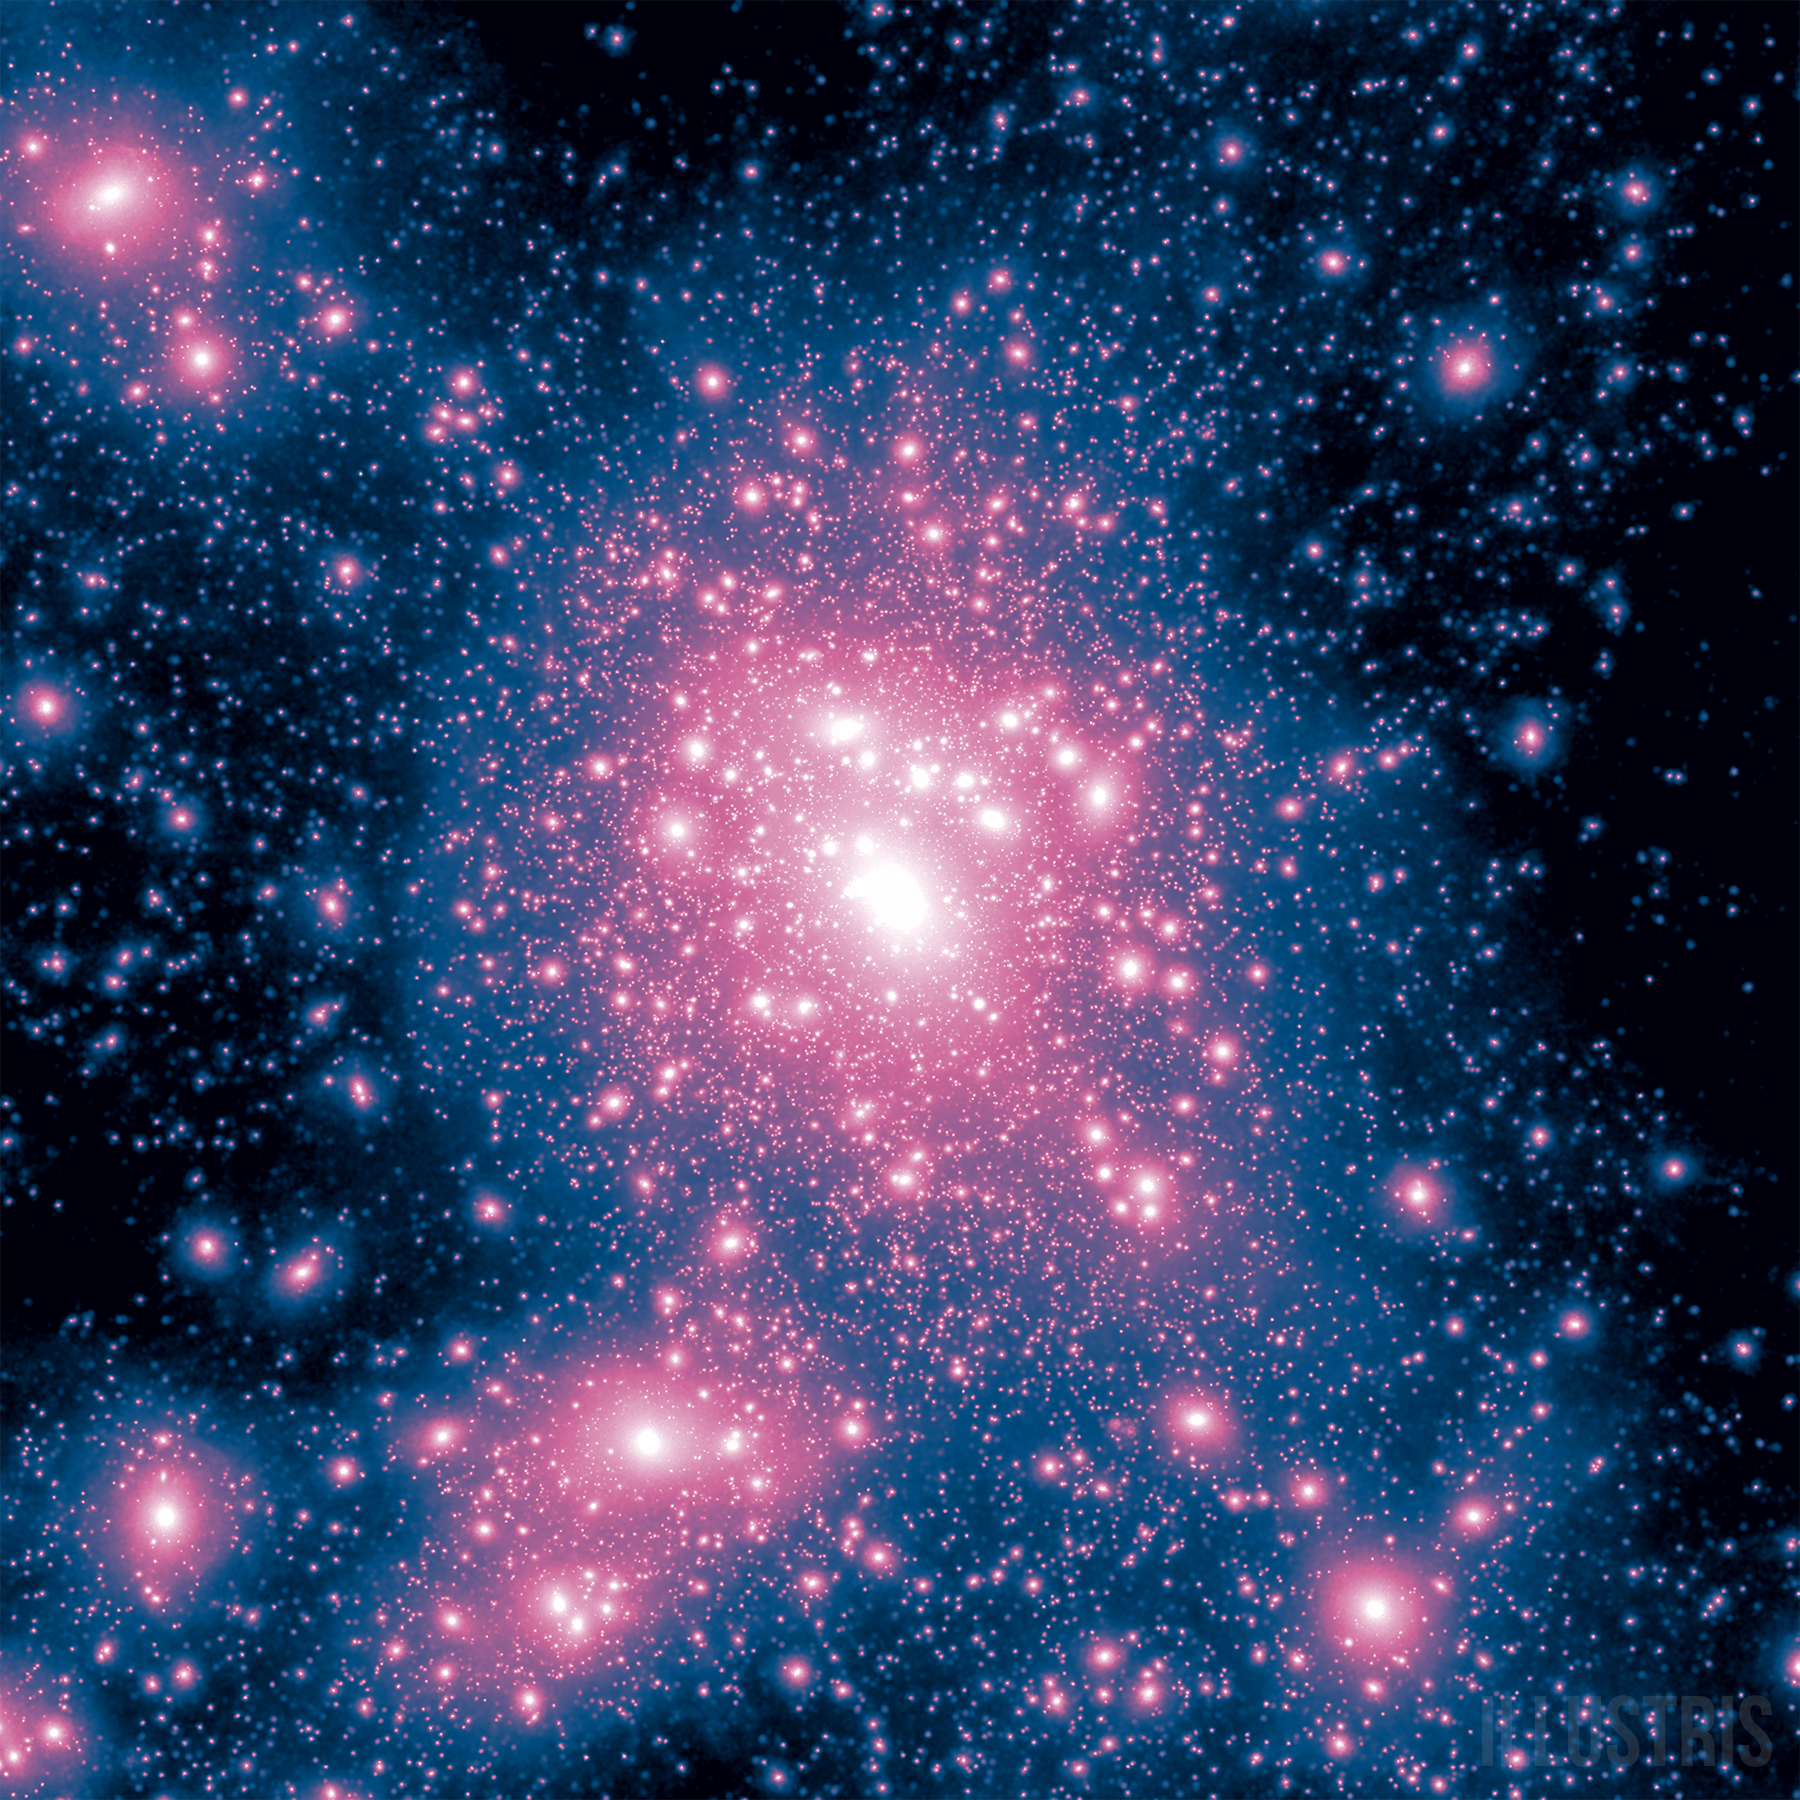
Dark matter annihilation radiation map of the most massive cluster at z=0, from a region enclosing three times the virial radius. The FoF group of this cluster only has over 65 million DM particles and 16,937 resolved substructures.
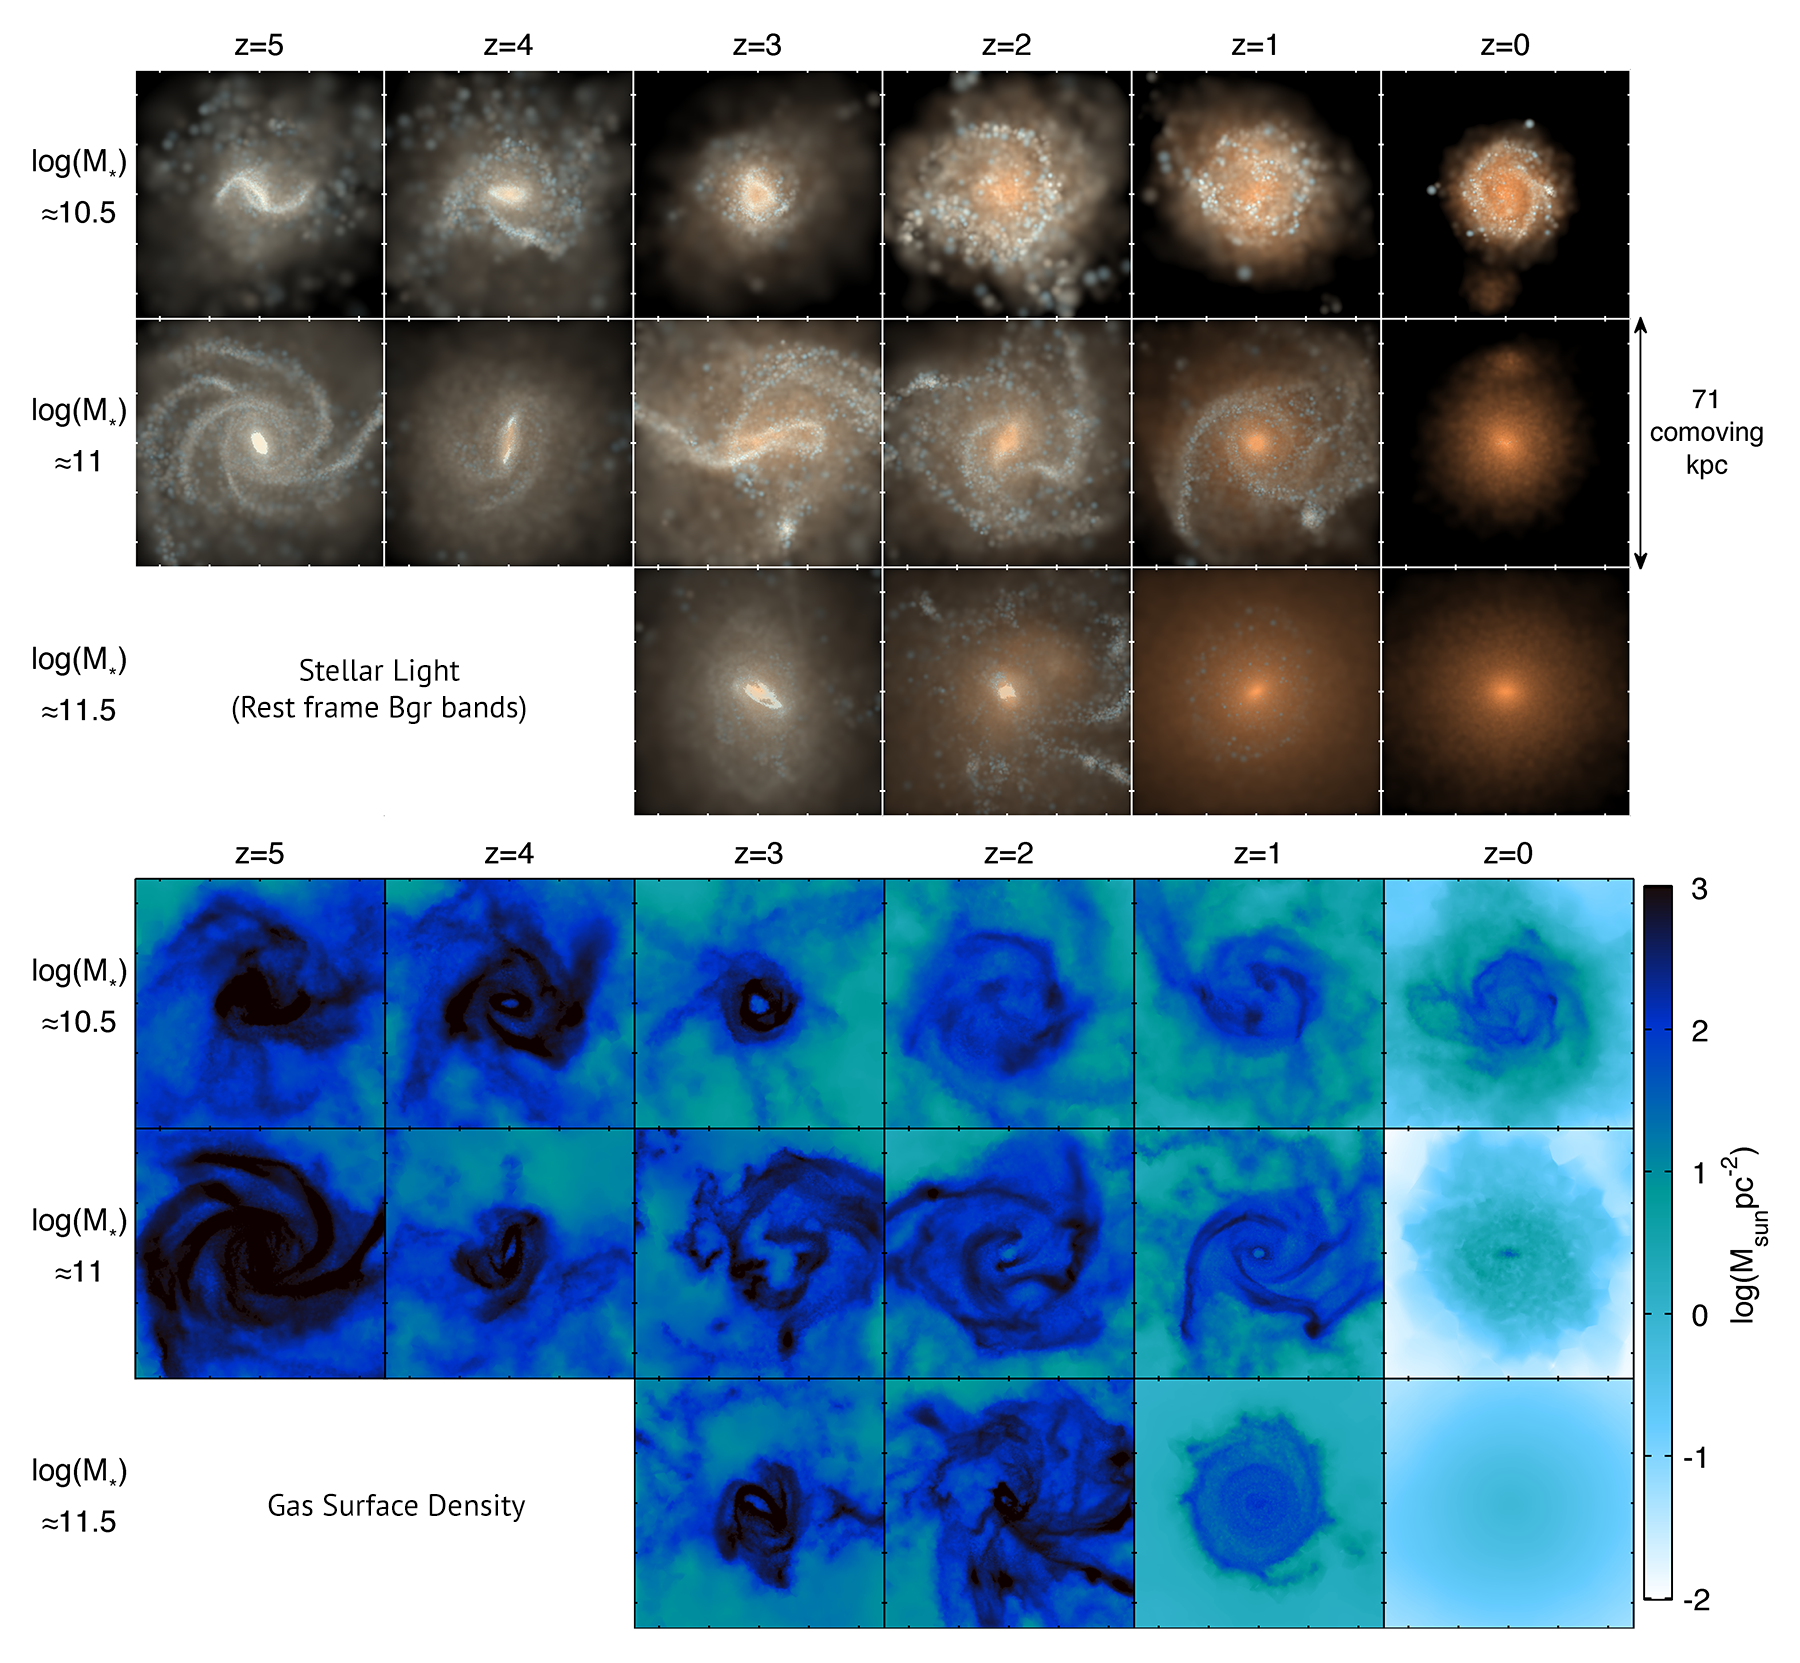
Sample of massive galaxies from z=5 (left) to z=0 (right), showing their stellar light distribution (rest-frame B,g,r band composites) and their gas surface densities.
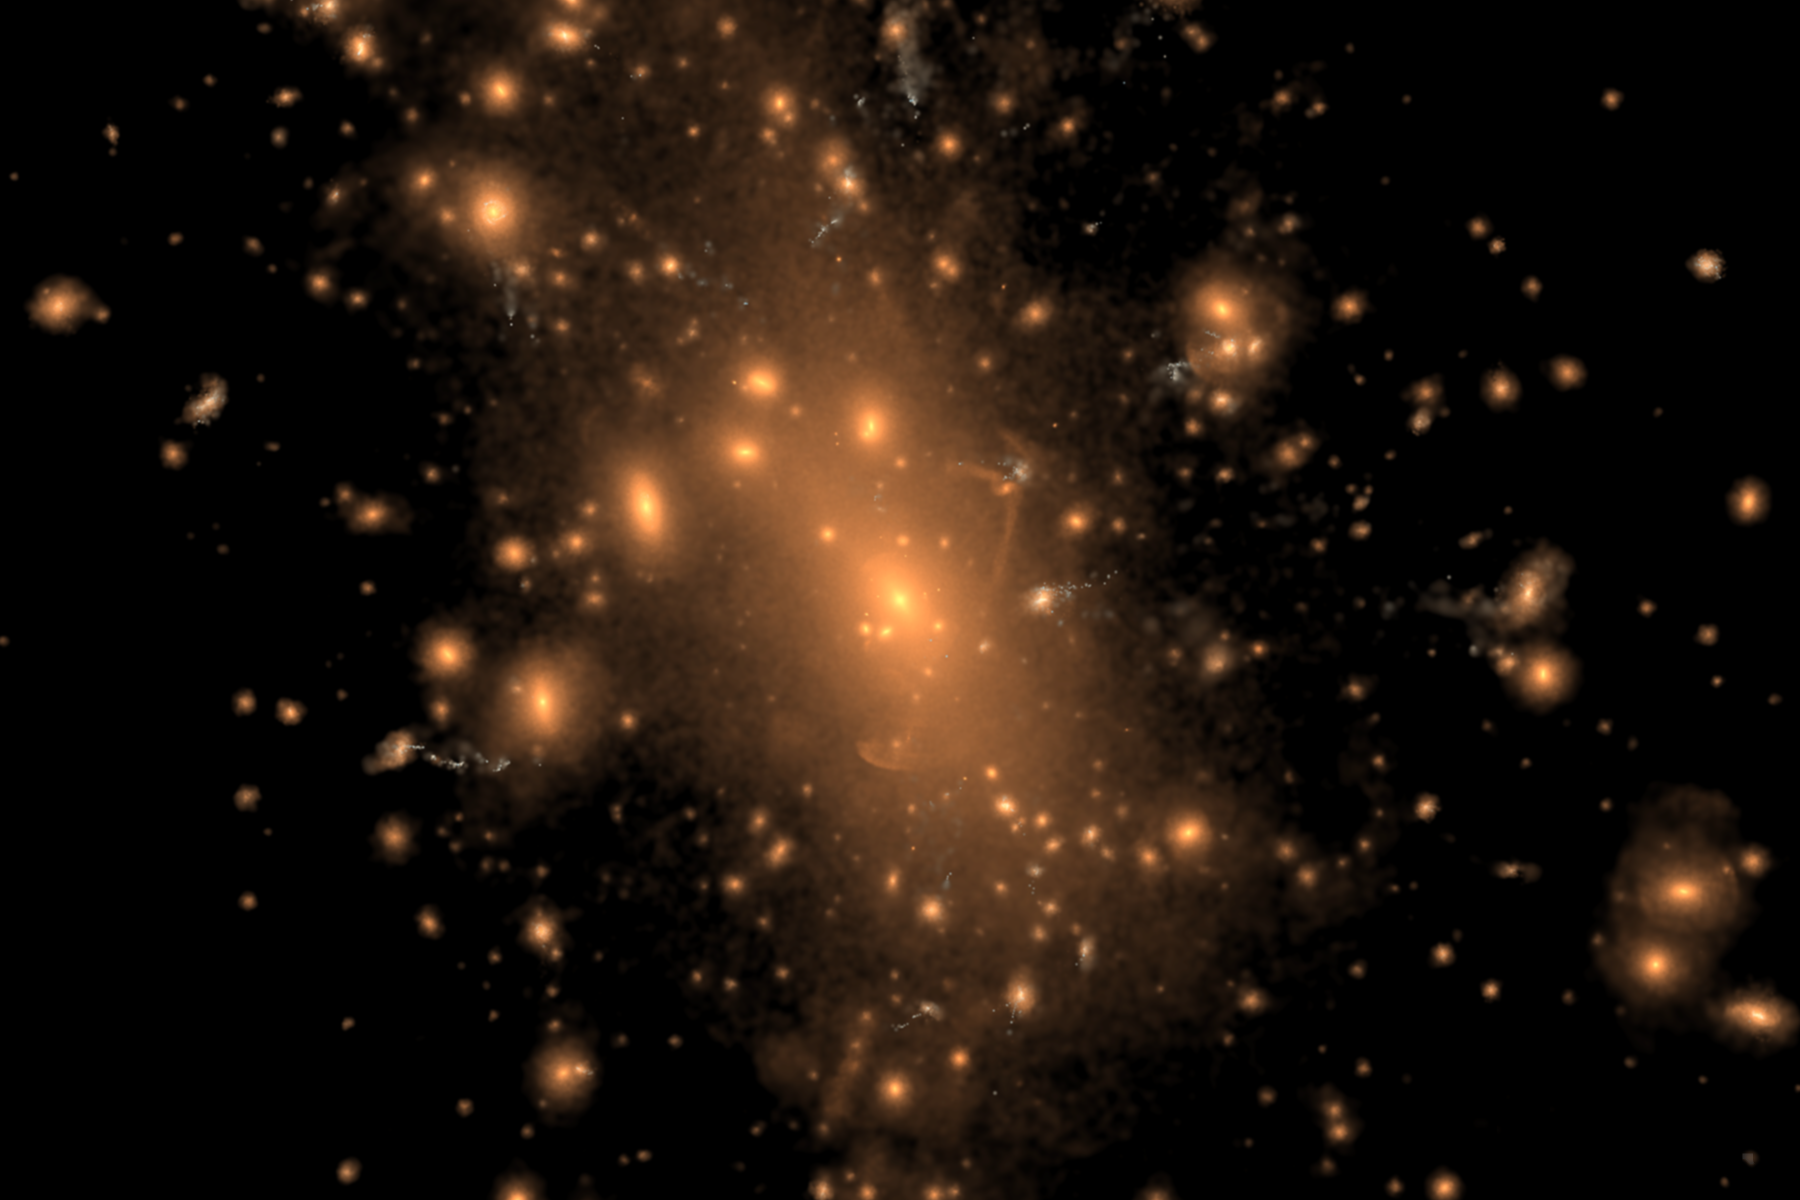
Stellar light distribution (rest-frame B,g,r band composites) of the most massive cluster in the simulation volume, at z=0.
Videos:
Encoded in H.264 format, available in 1080p widescreen HD (1920x1080), or 1000x1000 for square movies. For higher resolution (4K) please contact us.
Two great compilation videos are also available on Youtube: to compute the laws of nature (6:45 with music), and the Nature video a virtual universe (4:10 with narration).

Time evolution of a 10Mpc (comoving) region within Illustris from the start of the simulation to z=0. The movie transitions between the dark matter density field, gas temperature (blue: cold, green: warm: white: hot), and gas metallicity.
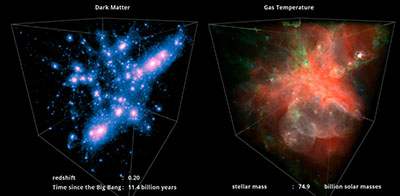
Full simulation cube showing dark matter and gas temperature at the present day. The cube has a sidelength of about 100 Mpc. The video shows the full matter distribution by slowly adding slices on top of each other.
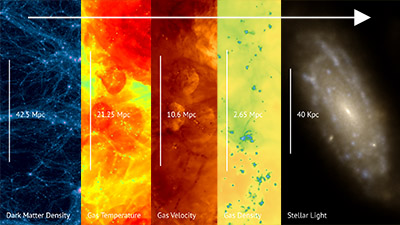
Continuous zoom-in from the scale of the entire simulation volume (~100 Mpc) to the scale of an individual spiral galaxy (~10 kpc), highlighting the diversity of structure across spatial scale, the large dynamic range of the simulation (106 per dimension), and the relationship between dark matter, gas, and stars.
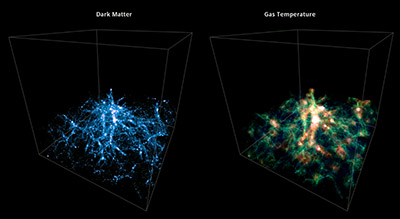
Time evolution of a 10Mpc (comoving) cubic region within Illustris, rendered from outside. The movies shows on the left the dark matter density field, and on the right the gas temperature (blue: cold, green: warm: white: hot). The rapid temperature fluctuations around massive haloes are due to radiative AGN feedback that is most active during quasar phases. The larger 'explosions' are due to radio-mode feedback.
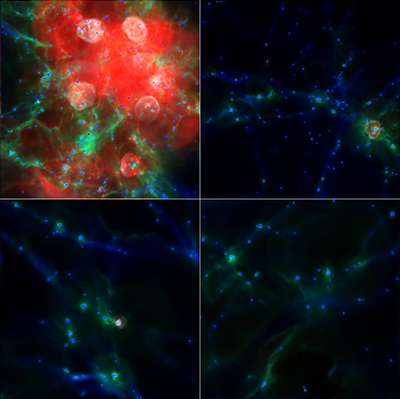
Time evolution of four separate sub-regions of the Illustris volume, from high redshift to z=0, showing gas temperature. Each region is several Mpc on a side, and each samples a different over-density relative to the cosmic mean, from highly over-dense (top left) to under-dense (counter-clockwise).
Time evolution of four separate quantities from high redshift to z=0, in an over-dense region 10 Mpc on a side. Panels show stellar light (top left), gas density (top right), gas temperature (bottom left), gas metallicity (bottom right).
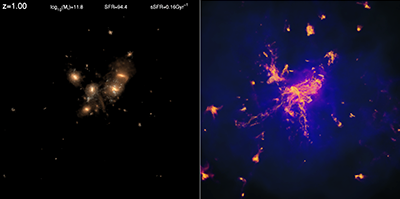
Time evolution from high redshift to z=0, demonstrating the formation of a massive elliptical 'red-and-dead' galaxy as a result of a multiple merger around z~1. Panels show stellar light (left) and gas density (right) in a region of 1 Mpc on a side.
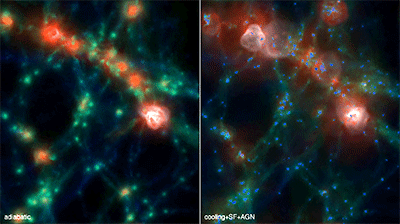
Time evolution of a 10Mpc (comoving) over-dense region within Illustris. While the right side shows a full-physics simulation that includes gas cooling, as well as stellar and black hole formation and feedback, the left side shows a simple simulation of the same region, which includes only gravity and hydrodynamics.
Additional Videos:
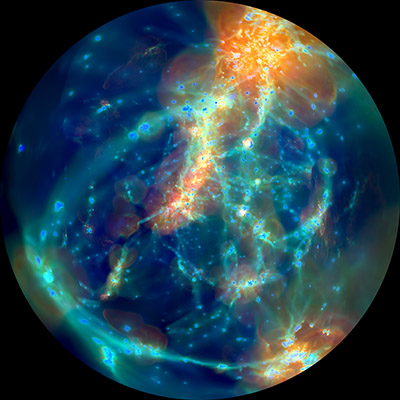
Dome master down-sampled to 2k, 180 degree view, monoscopic. Meant to be viewed in a full-dome digital planetarium. For full 4K or 8K frames please contact us. Shows the evolution of the universe from shortly after the Big Bang to the present day, in gas temperature (blue: cold, green/orange: warm, red/white: hot).
Time evolution of the hydrodynamic shocks in a dense sub-volume of the Illustris simulation. At early times accretion shocks onto the cosmic web are revealed, while at low redshift the picture is dominated by merger shocks and most importantly by highly energetic feedback shocks from black holes.
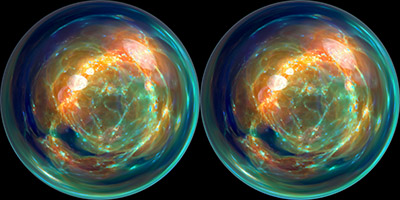
Full 360 degree, stereoscopic (left/right) render. Meant to be viewed in the Oculus Rift, with a tool such as the Whirligig Player, which will let you "look around" as the universe evolves around you. Visualizes the evolution of cosmic gas temperature on scales of ~10 Mpc from shortly after the Big Bang to the present day (blue: cold, green/orange: warm, red/white: hot). 4096x2048 resolution.
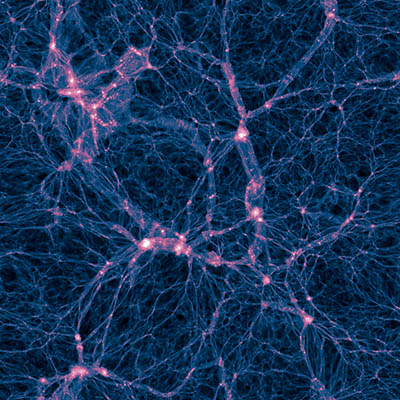
Animated projection of the dark matter density distribution across the full Illustris-1 box at redshift zero (fixed in time). Here a thin slice slides from the near side to the far side of the volume, revealing the three-dimensional structure.
Additional Images:
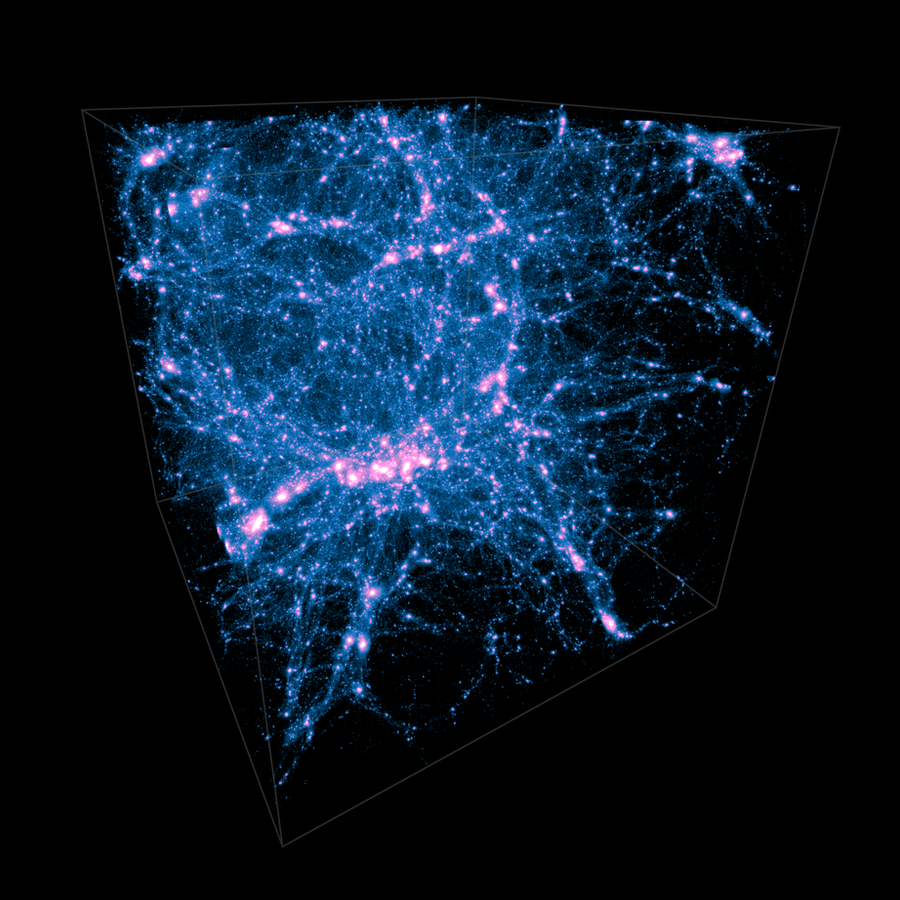
Exterior view of the dark matter density distribution in the full Illustris-1 box at redshift zero.
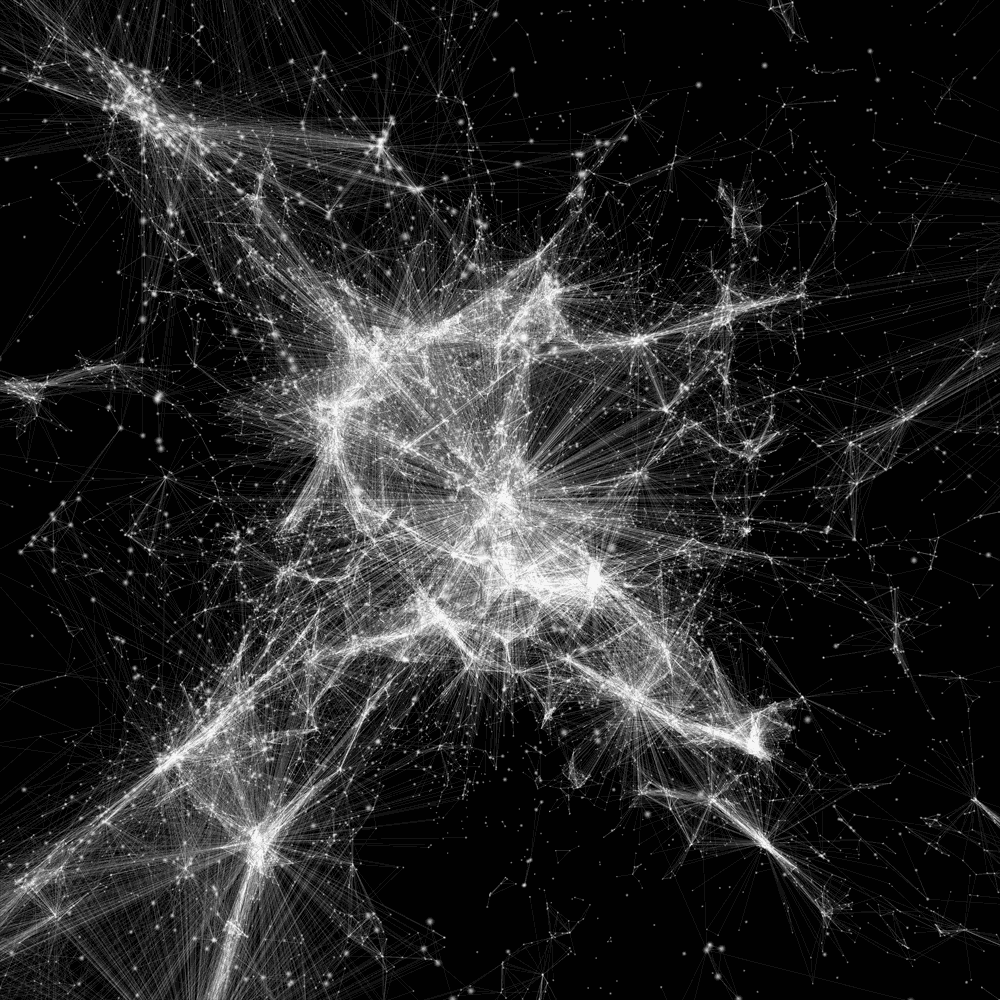
Visualization of the network-like topology of the Illustris-1 galaxy distribution from the point of view of graph theory. (Credit: Kim Albrecht. See the Cosmic Web Project Website for more).
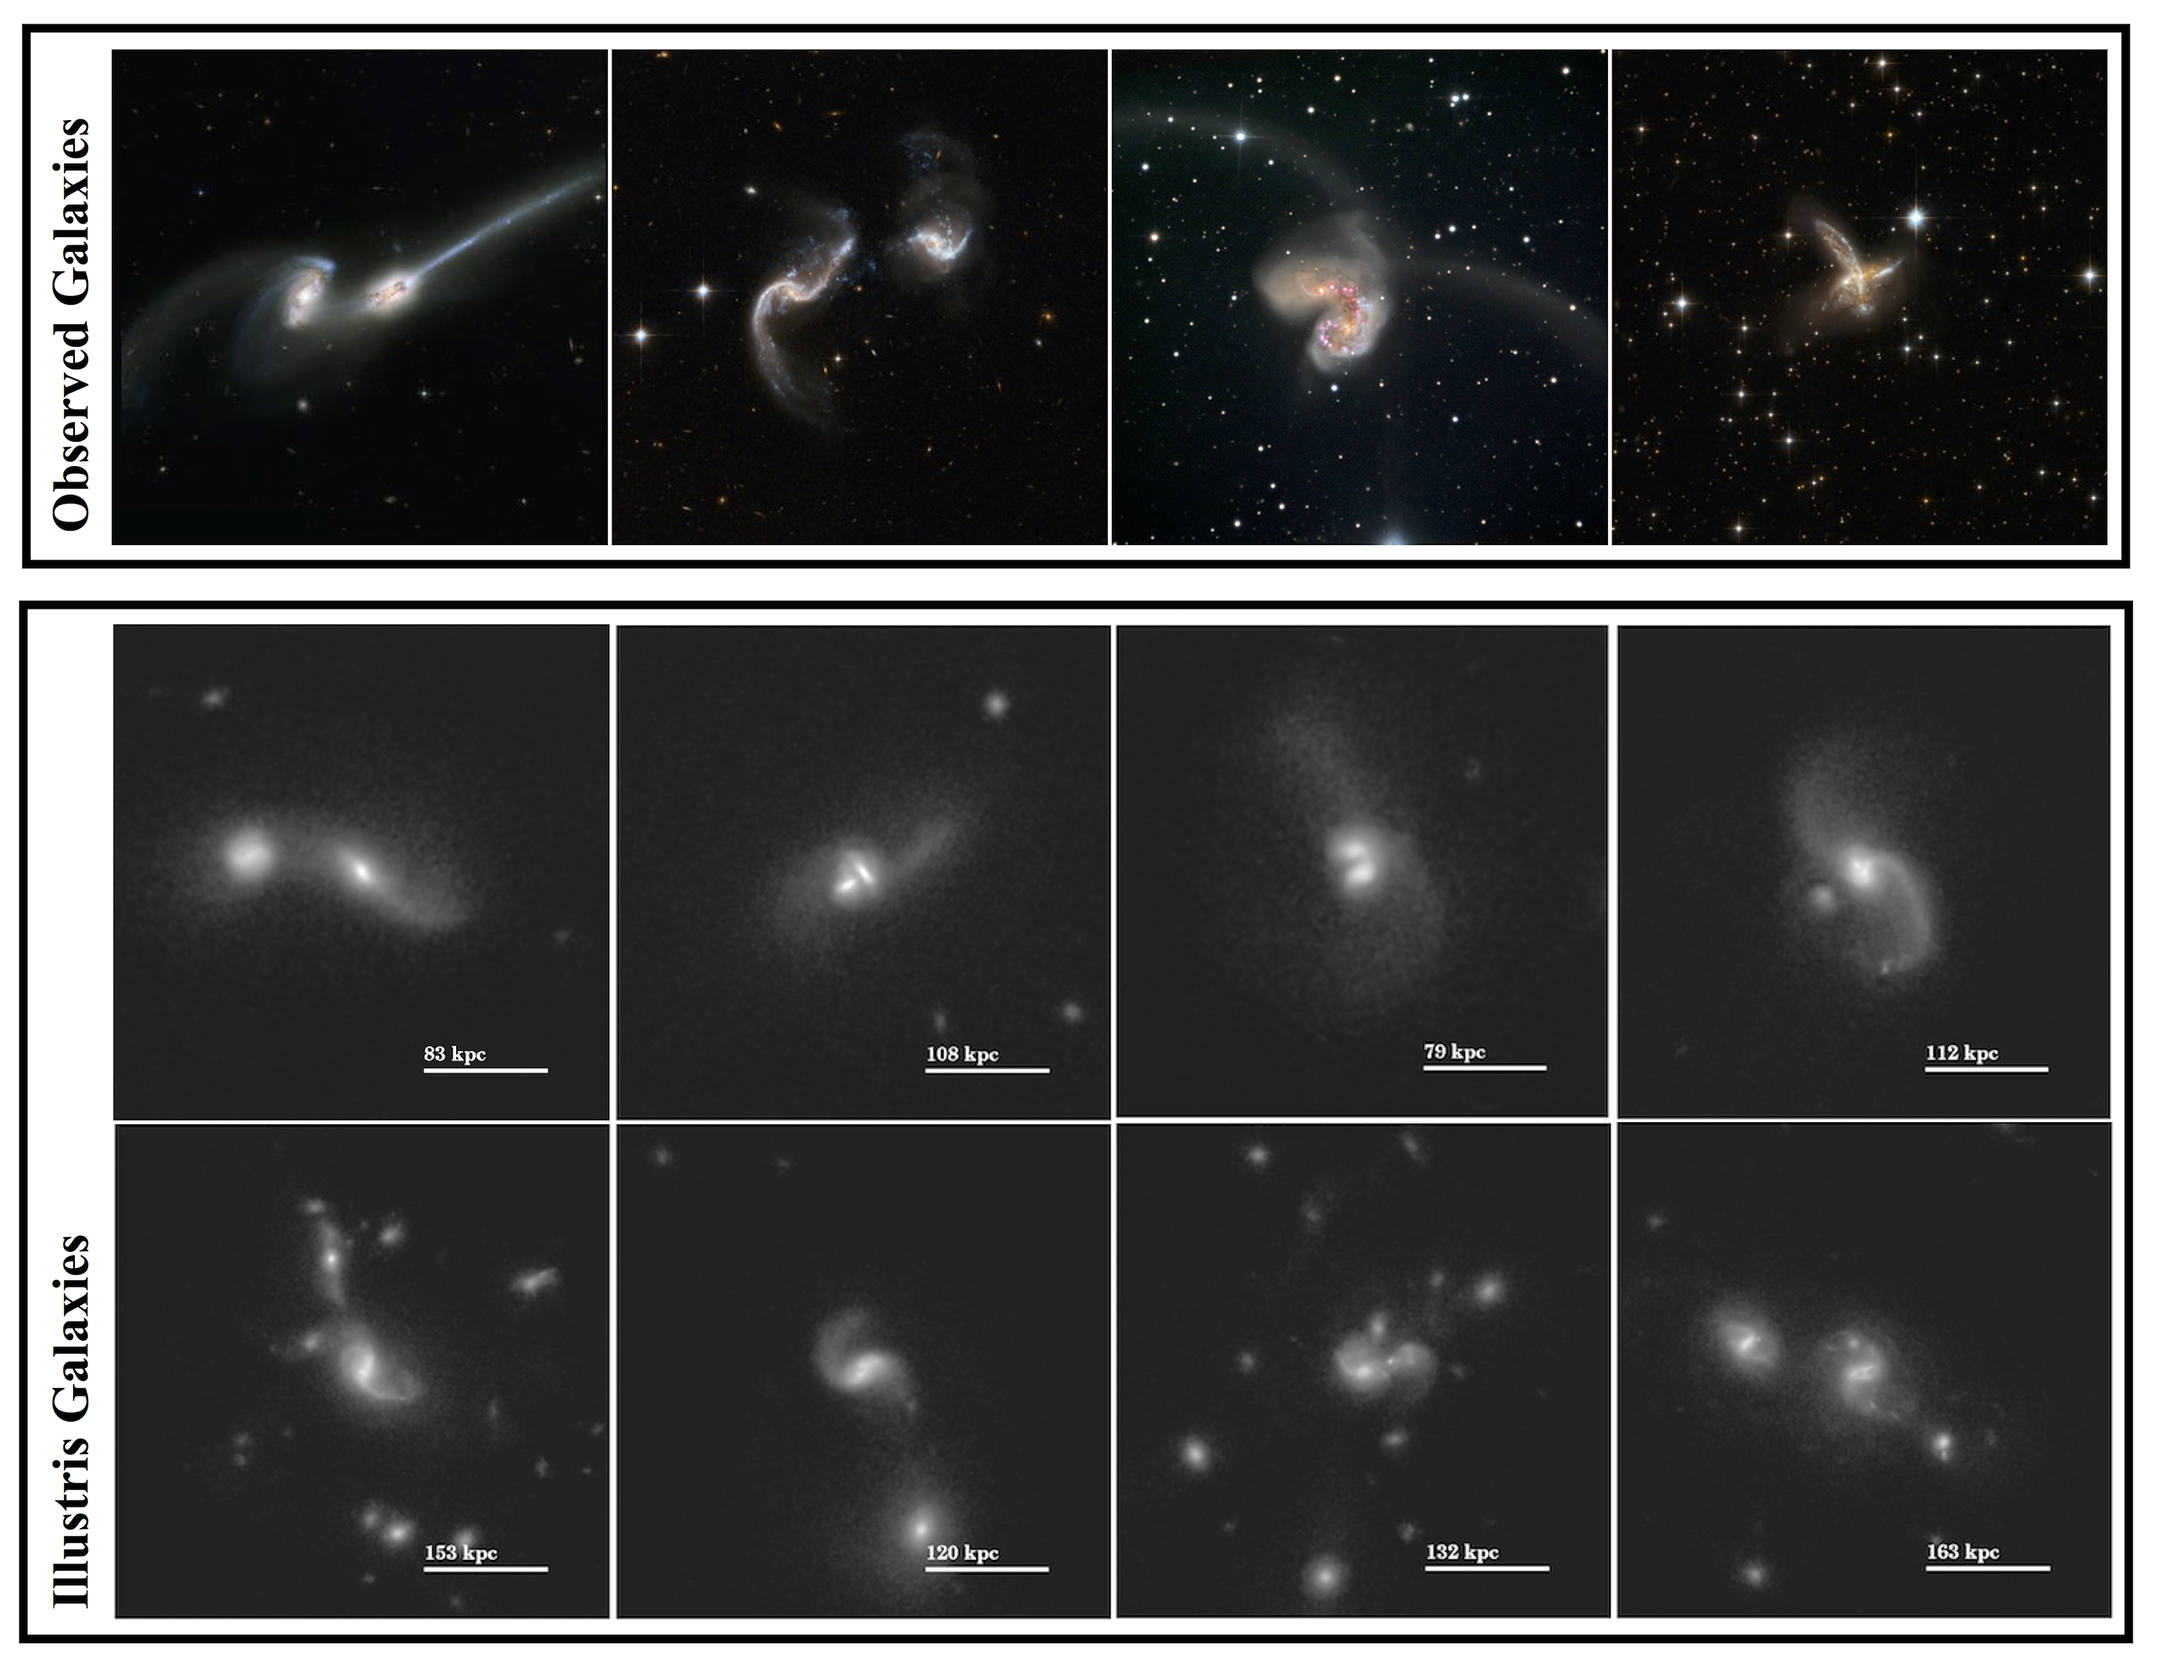
Images of observed interacting galaxies (top row) and Illustris interacting galaxies at z = 0.1, selected by inspection. While the observations are of stellar light, the simulated galaxies are shown in stellar mass projection.
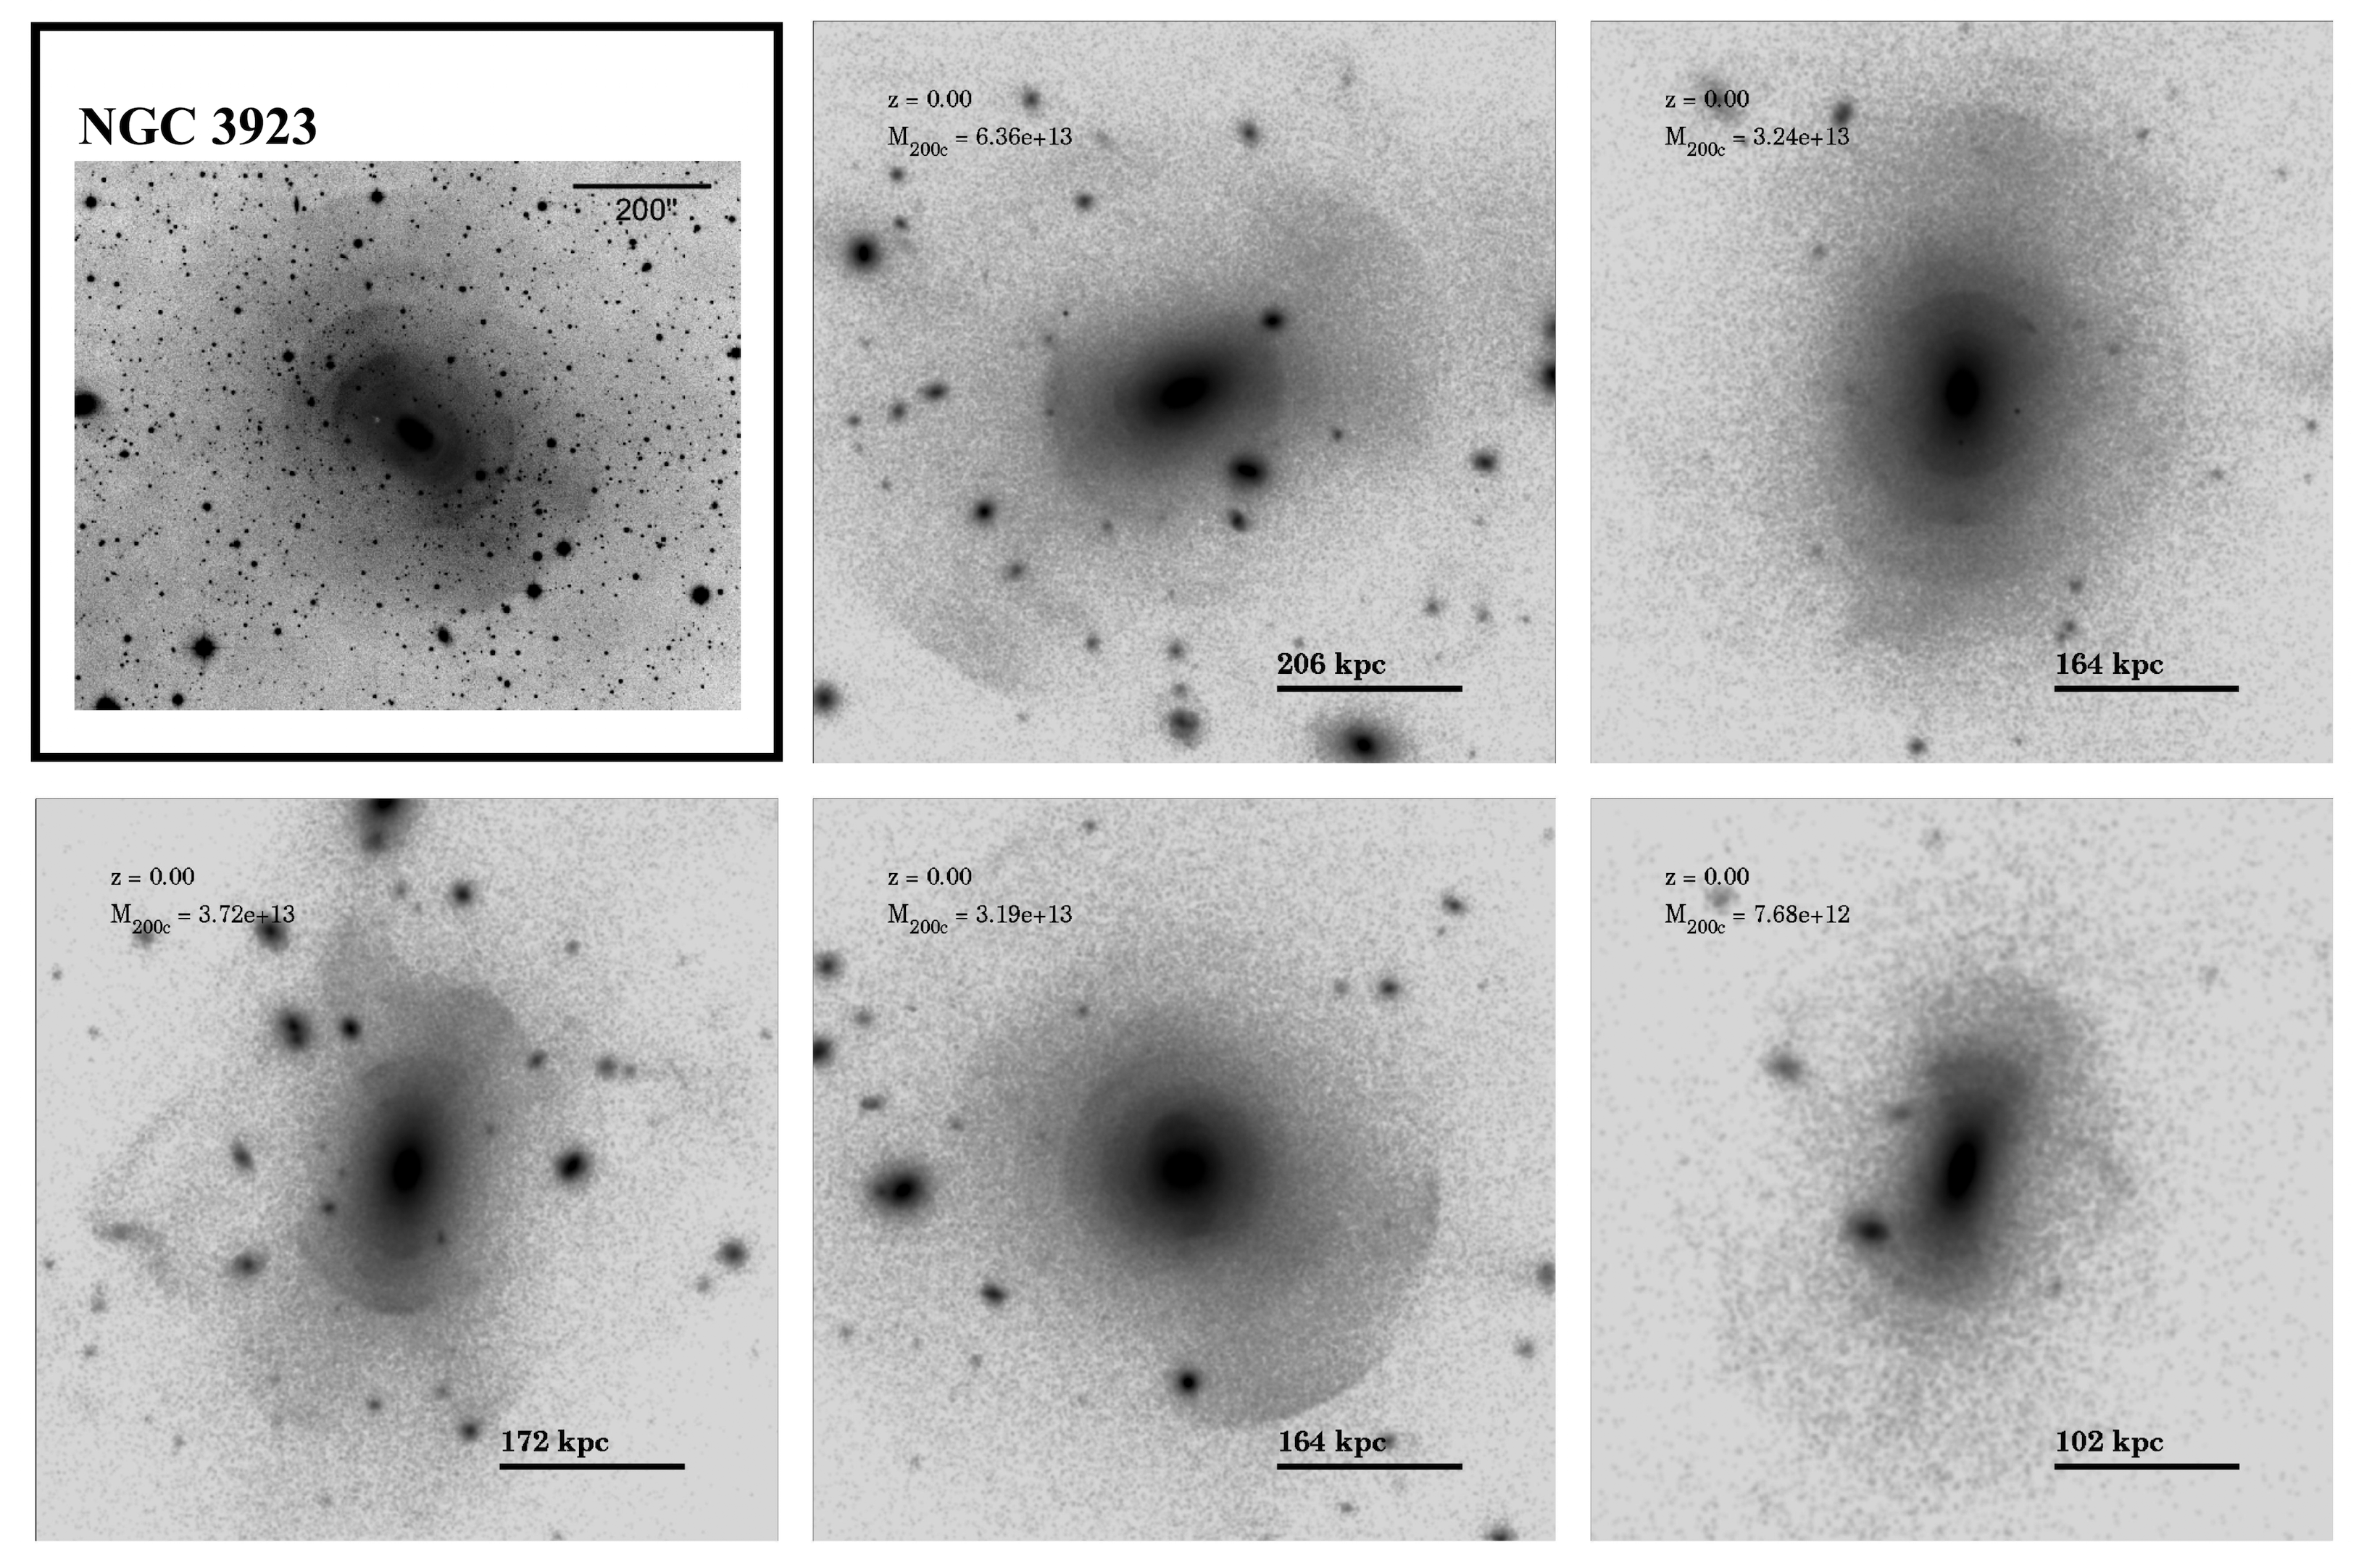
Images of stellar shells in the stellar halos of massive galaxies at z=0 from Illustris-1, in comparison to NGC 3923 (upper left corner). Stellar mass projections for the simulated galaxies.