I've being working with one of the 'mini' snapshots for TNG100, and found that NeutralHydrogenAbundance was not a data field for the mini snaps. I just wanted to ask if there was any method or work-around to compute neutral hydrogen abundance with the data supplied in the mini snaps?
Dylan Nelson
30 Jul '21
Yes, this field was removed from mini snapshots since it can be, in theory, reconstructed from the other available fields, following Rahmati+13. I post some code which may be a useful starting point:
def neutral_fraction(nH, sP, temp=1e4, redshift=None):
    """ The neutral fraction from Rahmati+ (2012) Eqn. A8. """
    # recombination rate from Rahmati+ (2012) Eqn. A3, also Hui & Gnedin (1997). [cm^3 / s] """
    lamb    = 315614.0/temp
    alpha_A = 1.269e-13*lamb**1.503 / (1+(lamb/0.522)**0.47)**1.923

    # photoionization rate
    if redshift is None:
        redshift = sP.redshift

    _, gamma_UVB_z = uvbPhotoionAtten(np.log10(nH), np.log10(temp), redshift)

    # A6 from Theuns 98
    LambdaT = 1.17e-10*temp**0.5*np.exp(-157809.0/temp)/(1+np.sqrt(temp/1e5))

    A = alpha_A + LambdaT
    B = 2*alpha_A + gamma_UVB_z/nH + LambdaT

    return (B - np.sqrt(B**2-4*A*alpha_A))/(2*A)
Ryan Flynn
2 Aug '21
Thank you! One question about the code you sent - what is the function uvbPhotoionAtten? Is that also from the Rahmati paper?
Dylan Nelson
2 Aug '21
Yes gamma_UVB_z is the value of the hydrogen photoionization rate, at the redshift of interest. Table 2 of Rahmati+ (should use FG09 to be most consistent with TNG).
Apologies on re-opening this thread, but I've also been working on reconstructing this field using the particle data.
After replicating the above code and using the FG09 model for gamma_UVB, I've created a plot of temperature vs neutral hydrogen abundance as a check for the most massive subhalo in TNG100-1 at snapshot 99, the left panel being the actual field in the TNG catalog and the right being my reconstruction. Although the shape of the curve looks correct, the two big issues are 1) there is a systematic offset in the y-direction of about 0.3 dex in my approximation, and 2) we aren't resolving the same level of scatter as seen in the original quantity. I'm wondering if I have missed a step or have done a wrong calculation, perhaps in calculating nH?
Dylan Nelson
20 May '22
Perhaps plot vs density instead of vs temperature? Perhaps the discrepancy is arising only for gas with density above the star-formation threshold?
Austen Gabrielpillai
6 Jun '22
Using a smaller subhalo for faster plotting and calculations, I've attached the following plot of the the two scatters overlaid on top of each other for a better, direct comparison. The left being neutral hydrogen abundance vs. temperature, and the right is neutral hydrogen abundance vs. density for both the TNG quantity and our approximation.
The offset between the two does not seem to be correctable by a factor, as taking the ratio between the truth and approximation shows that the ratio varies between 0.6 and 244. It also does not seem like an entirely simple fix as we can see different behavior in the right plot between Density [10^-5, 10^-3] and NeutralHydrogenAbundance [10^-2, 10^0].
Note that my temperature calculations come from the FAQ,
XH = 0.76 # the hydrogen mass fraction
gamma = 5.0/3.0 # the adiabatic index
KB = 1.3807e-16 # the Boltzmann constant in CGS units  [cm^2 g s^-2 K^-1]
mp = 1.6726e-24 # the proton mass  [g]
mu = (4*mp) / (1 + 3*XH + 4*XH*subhalo['ElectronAbundance'])
temp = (5/3 - 1) * (subhalo['InternalEnergy'] / KB)* mu* 1e10
my nH calculations are based on the following,
#           density                        convert to Msun / kpc^-3        Msun to g    kpc^-3 to cm^-3   divide by proton mass (g) to get number density
nH = 0.76 * np.double(subhalo['Density']) * (1.0e10 / 0.6774) * 0.6774**3 * 1.989e33 * 3.086e21**-3 / (mp)
and the neutral_fraction from the code snippet above in the thread.
Reviewing Rahmati+13. are we supposed to be using the total photoionization rate (given by A1) and not just the UVB ionization rate, or does the UVB give a good enough approximation?
Dylan Nelson
6 Jun '22
Perhaps do a temperature vs density plot to check? If by "Density" on the x-axis you aim to mean "Hydrogen Number Density [atoms / cm^3]", then something doesn't seem right. The effective ISM model should kick in at ~0.1 cm^-3, but this looks to be the feature at 1e-3 in your plot.
Austen Gabrielpillai
8 Jun '22
Apologies, by 'Density' I am referring to the direct quantity from the particle data. Attached is a new plot, where the first panel is temperature vs. the catalog's density parameter (in units of (10^10 M⊙/ h) / (ckpc / h)^3 ) (left) and temperature vs. hydrogen number density (in units of atoms / cm^3). The effective ISM model feature that you mentioned does appear to occur in the n_H vs. temperature plot at 0.1 cm^-3.
Antareep Gogoi
15 Oct '24
Hi, I've also been trying to get the NeutralHydrogenAbundance field for the mini snapshots. The table in Rahamati+13 seems to have values only at specific redshifts. Is there any way to get the value of gamma_UVB_z at different redshifts (say z=2.2,2.4, etc.)? It'd be helpful to have a look at the function uvbPhotoionAtten().
Dylan Nelson
15 Oct '24
This would just be via interpolation. Note that this function/method is not fully consistent with the simulations, only approximate.
def uvbPhotoionAtten(log_hDens, log_temp, redshift):
    """ Compute the reduction in the photoionisation rate at an energy of 13.6 eV at a given
    density [log cm^-3] and temperature [log K], using the Rahmati+ (2012) fitting formula.
    """
    import scipy.interpolate.interpolate as spi

    # Opacities for the FG09 UVB from Rahmati 2012.
    # Note: The values given for z > 5 are calculated by fitting a power law and extrapolating.
    # Gray power law: -1.12e-19*(zz-3.5)+2.1e-18 fit to z > 2.
    # gamma_UVB: -8.66e-14*(zz-3.5)+4.84e-13
    gray_opac = [2.59e-18,2.37e-18,2.27e-18,2.15e-18,2.02e-18,1.94e-18,1.82e-18, 1.71e-18,1.60e-18,2.8e-20]
    gamma_UVB = [3.99e-14,3.03e-13,6e-13,   5.53e-13,4.31e-13,3.52e-13,2.678e-13,1.81e-13,9.43e-14,1e-20]
    zz        = [0,       1,       2,       3,       4,       5,       6,        7,       8,       22]

    gamma_UVB_z    = spi.interp1d(zz, gamma_UVB) (redshift) [()] # 1/s (1.16e-12 is HM01 at z=3)
    gray_opacity_z = spi.interp1d(zz, gray_opac) (redshift) [()] # cm^2 (2.49e-18 is HM01 at z=3)

    f_bar = 0.167 # baryon fraction, Omega_b/Omega_M = 0.0456/0.2726 (Plank/iPrime)

    self_shield_dens = 6.73e-3 * (gray_opacity_z / 2.49e-18)**(-2.0/3.0) * \
      (10.0**log_temp/1e4)**0.17 * (gamma_UVB_z/1e-12)**(2.0/3.0) * (f_bar/0.17)**(-1.0/3.0) # cm^-3

    # photoionisation rate vs density from Rahmati+ (2012) Eqn. 14.
    # (coefficients are best-fit from appendix A)
    ratio_nH_to_selfShieldDens = 10.0**log_hDens / self_shield_dens
    photUVBratio = 0.98 * (1+ratio_nH_to_selfShieldDens**1.64)**(-2.28) + \
                   0.02 * (1+ratio_nH_to_selfShieldDens)**(-0.84)

    # photUVBratio is attenuation fraction, e.g. multiply by gamma_UVB_z to get actual Gamma_photon
    return photUVBratio, gamma_UVB_z
This was adapted long ago from an older version of this code from Simeon Bird.
Antareep Gogoi
16 Oct '24
Thank you!
Rodrigo Freitas
18 Feb '25
@Dylan Nelson said:
Yes, this field was removed from mini snapshots since it can be, in theory, reconstructed from the other available fields, following Rahmati+13. I post some code which may be a useful starting point:
def neutral_fraction(nH, sP, temp=1e4, redshift=None):
    """ The neutral fraction from Rahmati+ (2012) Eqn. A8. """
    # recombination rate from Rahmati+ (2012) Eqn. A3, also Hui & Gnedin (1997). [cm^3 / s] """
    lamb    = 315614.0/temp
    alpha_A = 1.269e-13*lamb**1.503 / (1+(lamb/0.522)**0.47)**1.923

    # photoionization rate
    if redshift is None:
        redshift = sP.redshift

    _, gamma_UVB_z = uvbPhotoionAtten(np.log10(nH), np.log10(temp), redshift)

    # A6 from Theuns 98
    LambdaT = 1.17e-10*temp**0.5*np.exp(-157809.0/temp)/(1+np.sqrt(temp/1e5))

    A = alpha_A + LambdaT
    B = 2*alpha_A + gamma_UVB_z/nH + LambdaT

    return (B - np.sqrt(B**2-4*A*alpha_A))/(2*A)
Hi Dylan,
Is there any specific reason why you use gamma_UVB_z on the definition of the B variable instead of photUVBratio * gamma_UVB_z ?
From the definition of B in Rahmati+2013 (just below eq. A7) I understood that one should use the total photoionization rate (Gamma_phot).
Yes you're right I believe, that looks like a bug in the code above. Thanks for pointing it out!
Rodrigo Freitas
20 Feb '25
Ok, thanks for clarifying!
Anyway, I still cannot recover the values of NeutralHydrogenAbundance column by using the equations from Rahmati+2013.
Maybe there is something important that I am missing. I will leave an example here in case you have any idea of what could be the problem.
In the diagrams below f_neutral is either the NeutralHydrogenAbundance or a value obtained with the functions suggested previously here in this Forum topic. Only non-starforming gas cells are plotted. The diagrams look pretty different:
The relevant code
def compute_Teff(part:dict,XH=0.76):
    #XH          = 0.76             # the hydrogen mass fraction
    gamma       = 5.0/3.0          # the adiabatic index
    kb          = 1.3807e-16       # the Boltzmann constant in CGS units  [cm^2 g s^-2 K^-1]
    mp          = 1.6726e-24       # the proton mass  [g]
    mu          = (4*mp)/(1+3*XH+4*XH*part['ElectronAbundance'][:])
    return (gamma-1)* (part['InternalEnergy'][:]/kb)* mu* 1e10

def neutral_fraction(nH, temp, redshift):
    """ The neutral fraction from Rahmati+ (2012) Eqn. A8. """
    # recombination rate from Rahmati+ (2012) Eqn. A3, also Hui & Gnedin (1997). [cm^3 / s] """
    lamb    = 315614.0/temp
    alpha_A = 1.269e-13*lamb**1.503 / (1+(lamb/0.522)**0.47)**1.923

    photUVBratio, gamma_UVB_z = uvbPhotoionAtten(np.log10(nH), np.log10(temp), redshift)

    # A6 from Theuns 98
    LambdaT = 1.17e-10*temp**0.5*np.exp(-157809.0/temp)/(1+np.sqrt(temp/1e5))

    A = alpha_A + LambdaT
    #B = 2*alpha_A + gamma_UVB_z/nH + LambdaT
    B = 2*alpha_A + (photUVBratio*gamma_UVB_z)/nH + LambdaT

    return (B - np.sqrt(B**2-4*A*alpha_A))/(2*A)

def uvbPhotoionAtten(log_hDens, log_temp, redshift):
    """ Compute the reduction in the photoionisation rate at an energy of 13.6 eV at a given
    density [log cm^-3] and temperature [log K], using the Rahmati+ (2012) fitting formula.
    """
    import scipy.interpolate as spi

    # Opacities for the FG09 UVB from Rahmati 2012.
    # Note: The values given for z > 5 are calculated by fitting a power law and extrapolating.
    # Gray power law: -1.12e-19*(zz-3.5)+2.1e-18 fit to z > 2.
    # gamma_UVB: -8.66e-14*(zz-3.5)+4.84e-13
    gray_opac = [2.59e-18,2.37e-18,2.27e-18,2.15e-18,2.02e-18,1.94e-18,1.82e-18, 1.71e-18,1.60e-18,2.8e-20]
    gamma_UVB = [3.99e-14,3.03e-13,6e-13,   5.53e-13,4.31e-13,3.52e-13,2.678e-13,1.81e-13,9.43e-14,1e-20]
    zz        = [0,       1,       2,       3,       4,       5,       6,        7,       8,       22]

    gamma_UVB_z    = spi.interp1d(zz, gamma_UVB) (redshift) [()] # 1/s (1.16e-12 is HM01 at z=3)
    gray_opacity_z = spi.interp1d(zz, gray_opac) (redshift) [()] # cm^2 (2.49e-18 is HM01 at z=3)

    f_bar = 0.167 # baryon fraction, Omega_b/Omega_M = 0.0456/0.2726 (Plank/iPrime)

    self_shield_dens = 6.73e-3 * (gray_opacity_z / 2.49e-18)**(-2.0/3.0) * \
      (10.0**log_temp/1e4)**0.17 * (gamma_UVB_z/1e-12)**(2.0/3.0) * (f_bar/0.17)**(-1.0/3.0) # cm^-3

    # photoionisation rate vs density from Rahmati+ (2012) Eqn. 14.
    # (coefficients are best-fit from appendix A)
    ratio_nH_to_selfShieldDens = 10.0**log_hDens / self_shield_dens
    photUVBratio = 0.98 * (1+ratio_nH_to_selfShieldDens**1.64)**(-2.28) + \
                   0.02 * (1+ratio_nH_to_selfShieldDens)**(-0.84)

    # photUVBratio is attenuation fraction, e.g. multiply by gamma_UVB_z to get actual Gamma_photon
    return photUVBratio, gamma_UVB_z
I've being working with one of the 'mini' snapshots for TNG100, and found that NeutralHydrogenAbundance was not a data field for the mini snaps. I just wanted to ask if there was any method or work-around to compute neutral hydrogen abundance with the data supplied in the mini snaps?
Yes, this field was removed from mini snapshots since it can be, in theory, reconstructed from the other available fields, following Rahmati+13. I post some code which may be a useful starting point:
Thank you! One question about the code you sent - what is the function uvbPhotoionAtten? Is that also from the Rahmati paper?
Yes
gamma_UVB_zis the value of the hydrogen photoionization rate, at the redshift of interest. Table 2 of Rahmati+ (should use FG09 to be most consistent with TNG).Apologies on re-opening this thread, but I've also been working on reconstructing this field using the particle data.
After replicating the above code and using the FG09 model for gamma_UVB, I've created a plot of temperature vs neutral hydrogen abundance as a check for the most massive subhalo in TNG100-1 at snapshot 99, the left panel being the actual field in the TNG catalog and the right being my reconstruction. Although the shape of the curve looks correct, the two big issues are 1) there is a systematic offset in the y-direction of about 0.3 dex in my approximation, and 2) we aren't resolving the same level of scatter as seen in the original quantity. I'm wondering if I have missed a step or have done a wrong calculation, perhaps in calculating nH?
Perhaps plot vs density instead of vs temperature? Perhaps the discrepancy is arising only for gas with density above the star-formation threshold?
Using a smaller subhalo for faster plotting and calculations, I've attached the following plot of the the two scatters overlaid on top of each other for a better, direct comparison. The left being neutral hydrogen abundance vs. temperature, and the right is neutral hydrogen abundance vs. density for both the TNG quantity and our approximation.
The offset between the two does not seem to be correctable by a factor, as taking the ratio between the truth and approximation shows that the ratio varies between 0.6 and 244. It also does not seem like an entirely simple fix as we can see different behavior in the right plot between Density [10^-5, 10^-3] and NeutralHydrogenAbundance [10^-2, 10^0].
Note that my temperature calculations come from the FAQ,
my nH calculations are based on the following,
and the neutral_fraction from the code snippet above in the thread.
Reviewing Rahmati+13. are we supposed to be using the total photoionization rate (given by A1) and not just the UVB ionization rate, or does the UVB give a good enough approximation?
Perhaps do a temperature vs density plot to check? If by "Density" on the x-axis you aim to mean "Hydrogen Number Density [atoms / cm^3]", then something doesn't seem right. The effective ISM model should kick in at ~0.1 cm^-3, but this looks to be the feature at 1e-3 in your plot.
Apologies, by 'Density' I am referring to the direct quantity from the particle data. Attached is a new plot, where the first panel is temperature vs. the catalog's density parameter (in units of (10^10 M⊙/ h) / (ckpc / h)^3 ) (left) and temperature vs. hydrogen number density (in units of atoms / cm^3). The effective ISM model feature that you mentioned does appear to occur in the n_H vs. temperature plot at 0.1 cm^-3.
Hi, I've also been trying to get the NeutralHydrogenAbundance field for the mini snapshots. The table in Rahamati+13 seems to have values only at specific redshifts. Is there any way to get the value of gamma_UVB_z at different redshifts (say z=2.2,2.4, etc.)? It'd be helpful to have a look at the function uvbPhotoionAtten().
This would just be via interpolation. Note that this function/method is not fully consistent with the simulations, only approximate.
This was adapted long ago from an older version of this code from Simeon Bird.
Thank you!
Hi Dylan,
Is there any specific reason why you use
gamma_UVB_zon the definition of theBvariable instead ofphotUVBratio * gamma_UVB_z?From the definition of B in Rahmati+2013 (just below eq. A7) I understood that one should use the total photoionization rate (Gamma_phot).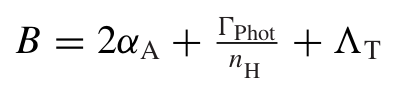
Hi Rodrigo,
Yes you're right I believe, that looks like a bug in the code above. Thanks for pointing it out!
Ok, thanks for clarifying!
Anyway, I still cannot recover the values of
NeutralHydrogenAbundancecolumn by using the equations from Rahmati+2013.Maybe there is something important that I am missing. I will leave an example here in case you have any idea of what could be the problem.
In the diagrams below f_neutral is either the
NeutralHydrogenAbundanceor a value obtained with the functions suggested previously here in this Forum topic. Only non-starforming gas cells are plotted. The diagrams look pretty different:The relevant code